
When it comes to illustrating the current state of nutrition in the U.S., most people go for the standard fruit and veggies factoid: Americans are eating more fruits and vegetables today than in 1970, but (you knew that "but" was coming...) the average diet still falls short of the recommendations, according to the USDA.
In 2015, only around 9 percent and 12 percent of U.S. adults eat enough veggies and fruit, respectively, according to the Centers for Disease Control and Prevention (CDC).
Video of the Day
Video of the Day
But nutrition is about a lot more than just how much produce we are — or aren't — eating. Find the most up-to-date nutrition statistics you need to know below, including data on how much food and specific nutrients we take in, healthy-eating facts and more.
Healthy-Eating Statistics
In the United States, most people fall short of the recommended amounts for various food groups.
- More than 80% of Americans' diets are low in vegetables, fruits and dairy, according to the 2020-2025 Dietary Guidelines for Americans.
- 2.7% of Americans have a "healthy lifestyle," meaning they meet four qualifications, according to an April 2016 study in Mayo Clinic Proceedings:
- being sufficiently active
- eating a healthy diet
- being a nonsmoker
- having a healthy body fat percentage
Fruit and Vegetable Consumption in the United States
Residents in the following states were most likely to report eating at least five servings of vegetables four or more days per week in 2013, according to a 2014 Gallup poll:
- Vermont (67.8%)
- Montana (63%)
- Washington (61.8%)
- Oregon (61.4%)
- New Mexico (61.1%)
- Colorado (60.6%)
- Wyoming (60.3%)
- Maine (59.9%)
- Arizona (59.9%)
- Alaska (59.8%)
Residents in the following states were least likely to report eating at least five servings of vegetables four or more days per week in 2013, according to the Gallup poll:
- Ohio (55.6%)
- Texas (55.5%)
- Kansas (55.5%)
- Iowa (55.4%)
- Arkansas (54.6%)
- West Virginia (54.5%)
- Delaware (54.3%)
- Missouri (53.8%)
- Louisiana (53.3%)
- Oklahoma (52.3%)
- 8.5% of high school students met fruit recommendations and 2.1% met vegetable recommendations, according to an April 2017 study in the Journal of the Academy of Nutrition and Dietetics.
- On average, American adults eat fruit once a day and vegetables 1.7 times a day, according to the CDC.
- Teens eat fruit about 0.2 times a day and vegetables about 0.1 times a day, according to the Journal of the Academy of Nutrition and Dietetics study.
The Most Popular Foods in the U.S.
Curious about what Americans eat? To start, they're eating more than before: All major food categories increased in the amount of food available for consumption from 1970 to 2008, and the average daily calories per person in the marketplace spiked by about 600 calories, per the 2010 Dietary Guidelines for Americans.
Here are some more interesting food consumption statistics to know. Note that the food availability data below reflects how much food is available to American consumers per year.
Fruits
- Apples were the top fruit available to eat in the U.S. as of 2018, with about 10 pounds of apples available per person, 1.6 gallons of apple juice available per person and 3.1 pounds of canned, dried and frozen apples per person, according to the USDA.
- Bananas are the most popular fresh fruit in the U.S., with 13.9 pounds available per person, according to the USDA.
- Orange juice is the top juice in the U.S., with 2.1 gallons available per person, according to the USDA.
Vegetables
- Potatoes are the most commonly eaten vegetable in the U.S. In 2019, 49.4 pounds of potatoes were available per person.
- 41% of available potatoes were frozen.
- The most common way of eating potatoes was as french fries.
- Tomatoes are the second most commonly eaten vegetable in the U.S. In 2019, 31.4 pounds of tomatoes per person were available, according to the USDA.
- 60% of available tomatoes were canned.
- The most common way of eating tomatoes was as pizza sauce.
- The third most popular vegetable, onions, added up to 9.4 pounds per person, according to the USDA.
Dairy
- The number of dairy products available for consumption was 1.5 cup-equivalents of dairy per person per day in both 1977 and 2017, according to the USDA.
- Although the overall quantity is the same, the availability of fluid milk fell from 0.9 to 0.5 cups per person per day, while cheese availability doubled.
Meats
- Chicken became much more available in the 1940s and eventually overtook pork as the second most-eaten meat in 1996.
- Since 1970, U.S. chicken availability per person has more than doubled, according to the USDA.
- In 2018, there were 65.2 pounds of chicken per person available to eat, compared to 54.6 pounds of beef.
- Americans ate more than the recommended amounts of meat, eggs, nuts and grains in 2017, according to the USDA.
Sweeteners, Grains and Fats
- In 2017, there were 123.2 pounds per person of caloric sweeteners available for consumption, down from a high of 151.5 pounds in 1999, according to the USDA.
- The availability of total corn sweeteners (glucose syrup, high-fructose corn syrup and dextrose) fell from 83.6 pounds per person in 1999 to almost 53 pounds in 2019, according to the USDA.
- Refined sugar (cane and beet) surpassed corn sweeteners in 2010 and reached an availability of 69.3 pounds per person in 2019, according to the USDA.
- There were 36.5 pounds of corn products (flour and meal, hominy and grits and food starch) available for consumption per person in 2019, which was up from 21.8 pounds per person in 1989, according to the USDA.
- Wheat flour availability was 131.1 pounds per person in 2019 compared to its peak of 146.8 pounds in 1997, according to the USDA.
- The availability of added fats and oils reached 82.2 pounds per person in 2010, compared with 52.5 pounds per person in 1970.
- On average, Americans took in 63 grams of added oils per person per day in 2010, according to a January 2017 USDA report, which notes added fats and oils data was only available through 2010.
- 44.7 grams came from healthy oils like olive oil.
- 14.7 grams came from solid fats from butter, lard, shortening and tallow.
Food Accessibility in the U.S.
Nutrition isn't always a matter of choice. Many people across the country don't have access to healthy foods due to where they live or their budgets. Here are the food desert and food insecurity statistics you need to know.
- 17.4% of the population (an estimated 54 million people) lived in low-income areas and low-access areas (more than a mile from the nearest supermarket or grocery store in urban areas or 10 miles away in rural areas), according to the USDA.
- It's estimated that 49.1 million people, including 16.7 million children, experienced food insecurity (which means they had limited access to safe and nutritionally adequate foods) multiple times throughout the year in 2008, according to the USDA.
- More households were becoming food-secure as of 2019, according to the USDA. The prevalence of food insecurity was:
- 10.5% in 2020
- 11.1% in 2018
- 14.9% in 2011
- In 2019, 4.1% of households experienced very low food security, meaning they reported cutting or skipping meals and not eating enough because they didn't have enough money for food, according to the USDA.
- In March and April 2020, national estimates of food insecurity more than tripled to 38%, according to the American Journal of Public Health.
- 7% of adults living at or below the poverty level meet the daily vegetable recommendation in the U.S. compared to 11.4% of adults with the highest household incomes, according to the CDC.
- 21% of farmers' markets accept Supplemental Nutrition Assistance Program (SNAP, formerly called food stamps) benefits and 25.8% accept Special Supplemental Nutrition Program for Women, Infants, and Children (WIC) Farmers Market Nutrition Program coupons, according to a November 2013 report in Advances in Nutrition.
- 30.8% of farmers' markets accept WIC Farmers Market Nutrition Program vouchers, which can help lower-income families meet dietary recommendations for fruits and vegetables and address food insecurity, according to the CDC.
- Certain states are working to create strong regional food systems that help residents buy more locally sourced foods, including fruits and vegetables.
- 32 states have an active state food policy council and there are 234 active local food policy councils, according to the CDC.
Help Combat Food Insecurity With These Organizations
Fast-Food Statistics
Fast food is associated with poor diet quality and high caloric intake, per the CDC. While a burger and fries may make a delicious occasional meal, limiting your fast-food intake can help you maintain a healthier diet and avoid diseases related to poor nutrition.
Note that nutrition research typically categorizes people into female and male groups, which is why we use the terms "women" and "men" below. And to ensure accuracy, the terms we use below for race and ethnicity reflect the language used in each cited source.
- The number of fast-food restaurants has more than doubled since the 1970s, according to the 2010 Dietary Guidelines for Americans.
- 36.3% of children and adolescents ate fast food on any given day from 2015 to 2018, according to the CDC. They ate, on average, 13.8% of their daily calories from fast food.
- Non-Hispanic white children ages 12 to 19 took in a lower percentage of calories from fast food on a given day than Hispanic or non-Hispanic Black children from 2015 to 2018, according to the CDC.
- The percentage of calories children and adolescents ate from fast food decreased from 14.1% in 2003 to 2004 to 10.6% in 2009 to 2010. However, it then increased to 14.4% in 2017 to 2018, according to the CDC.
- The percentage of adults who ate fast food in 2018 lowered with age:
- 44.9% of adults ages 20 to 39
- 37.7% of adults ages 40 to 59
- 24.1% of adults ages 60 and over
- A higher number of non-Hispanic Black adults ate fast food than non-Hispanic white, non-Hispanic Asian and Hispanic adults, according to the CDC.
- The percentage of adults who ate fast food increased with increasing family income from 2013 to 2016, according to the CDC.
- Among those who ate fast food, men were more likely than women to eat fast food at lunch from 2013 to 2016, according to the CDC. Women, however, were more likely to report eating it as a snack.
- More than 56% of Americans who dine at restaurants or order takeout do so at least two to three times per week, according to a 2019 survey of 1,000 Americans by restaurant and hospitality company Fourth.
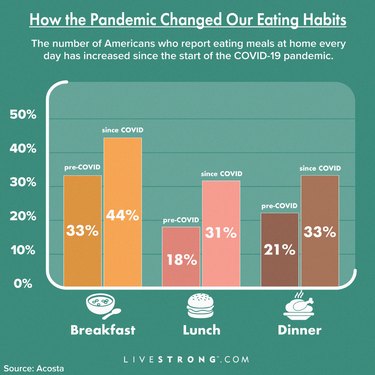
- Since the start of the COVID-19 pandemic, 55% of American shoppers are eating at home more often, according to a 2020 report from the marketing company Acosta.
- 44% eat breakfast at home every day (compared to 33% pre-COVID).
- 31% eat lunch at home every day (compared to 18% pre-COVID).
- 33% eat dinner at home every day (compared to 21% pre-COVID).
Sugar Statistics
Added sugars are sugars and syrups mixed into foods or beverages during preparation or processing, and do not include naturally occurring sugars like those found in fruit or milk, according to the CDC.
Americans eat too much added sugar, which includes raw sugar, brown sugar, corn syrup, dextrose, fructose, glucose, honey, molasses and more, according to the 2015-2020 Dietary Guidelines for Americans. You should limit added sugars to less than 10 percent of total daily calories (say, 200 calories from added sugar in a 2,000-calorie diet). Eating too many added sugars is linked to health problems like obesity, heart disease and type 2 diabetes.
Note that nutrition research typically categorizes people into female and male groups, which is why we use the terms "women" and "men" below. And to ensure accuracy, the terms we use below for race and ethnicity reflect the language used in each cited source.
- The average percentage of total daily calories from added sugars was 13% or 335 calories for men and 13% or 239 calories for women ages 20 and older from 2005 to 2010, according to the CDC.
- For kids ages 2 to 19, added sugar made up to 16% of daily calories, averaging about 362 calories for boys and 282 calories for girls, from 2005 to 2008, according to the CDC.
- In those ages 2 to 18, non-nutritive calories from added sugars and solid fats make up 40% of total daily calories, according to an October 2010 study in the Journal of the American Dietetic Association.
- Half of the non-nutritive calories consumed by 2- to 18-year-olds are derived from just six sources, according to the Journal of the American Dietetic Association:
- Soda
- Fruit drinks
- Dairy desserts
- Grain desserts
- Pizza
- Whole milk
- Americans ages 6 and older took in about 14% of their total daily calories from added sugars in 2003 to 2010, according to the CDC. The top sources of added sugars in the American diet are:
- Sugar-sweetened beverages
- Grain-based desserts like cakes and cookies
- Candy
- Dairy desserts like ice cream
- Non-Hispanic white children take in more added sugars than Mexican-American children, and non-Hispanic Black adults take in more added sugars than non-Hispanic white and Mexican-American adults, according to the CDC.
- Added sugar consumption is higher among adults with a lower income, according to the CDC.
- Added sugar intake is higher among adults who are younger, less physically active, less educated, currently smoke and formerly or currently drink infrequently or lightly, according to the CDC.
Sodium Statistics
It doesn't just come in the form of a salt shaker: Sodium is most commonly eaten via pizza, sandwiches, soups, burritos and savory snacks, according to the Harvard T.H. Chan School of Public Health. Too much sodium in your diet is associated with high blood pressure, heart disease and stroke.
- About 90% of Americans take in more sodium than what's recommended for a healthy diet, according to the CDC.
- The current guidelines call for less than 2,300 mg daily of sodium, but American adults consume an average of 3,400 mg per day (almost 50% more than what's generally recommended), according to the U.S. Food & Drug Administration.
- Reducing the average American's sodium intake by 1,200 mg per day could cut medical costs by up to $20 billion per year, according to the CDC.
Plant-Based Diet Statistics
Although more Americans are eager to include alternatives to animal products in their diets, many do not want to give up animal-based foods completely, according to an August 2018 Gallup poll.
However, eating less meat comes with benefits: People who ate more plant-based foods while cutting down on animal products were observed to have a lower risk of dying from a stroke, heart attack or another heart-related event, per an August 2019 study in the Journal of the American Heart Association.
- 5% of American adults consider themselves to be vegetarian, according to the Gallup poll.
- Nonwhite Americans (9%) are three times likelier than white Americans (3%) to describe themselves as vegetarian, according to the Gallup poll.
- 11% of self-identified liberals classify themselves as vegetarian compared to 2% of conservatives and 3% of moderates, according to the Gallup poll.
- Older adults are less likely to be vegetarian, according to the Gallup poll:
- 2% of adults ages 65 and older say they're on a vegetarian diet
- 3% of adults ages 50 to 64 say they're on a vegetarian diet
- 8% of adults ages 30 to 49 say they're on a vegetarian diet
- 7% of adults ages 18 to 29 say they're on a vegetarian diet
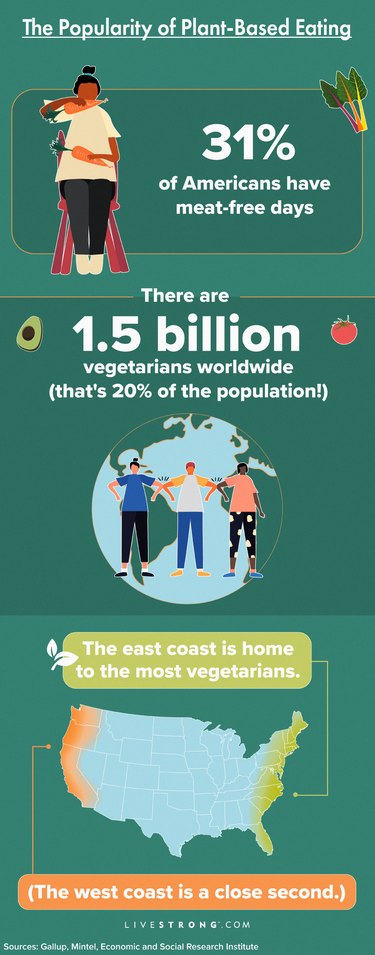
- In the U.S., the East (8%) and West (6%) have the most vegetarians. In the Midwest and South, just 4% of respondents considered themselves vegetarians, according to a Gallup poll.
- 3% of Americans said they were vegan in 2018, up slightly from 2% in 2012, according to the Gallup poll.
- Sales of plant-based food grew by 8.1% in 2017 alone, according to the Gallup poll.
- 31% of Americans occasionally have meat-free days, according to a February 2017 report from market research company Mintel.
- There's an estimated 1.5 billion vegetarians in the world (20% of the population), according to a January 2010 working paper from the Economic and Social Research Institute in Ireland and Vrije Universiteit in Amsterdam. For many, this is out of necessity due to the cost of meat.
Hydration Statistics
Plain drinking water contains no calories and can help with managing body weight and reducing caloric intake when it's used in place of calorie-containing drinks like soda. Drinking water can also prevent dehydration, which can lead to unclear thinking, mood change, constipation, kidney stones and more, according to the CDC.
There isn't a recommendation for how much water adults and children should drink daily. But because we typically get about 20 percent of the water we need from the food we eat, adults generally need between 9 and 12.5 cups (or 72 to 100 ounces) of fluid per day, according to the Academy of Nutrition and Dietetics.
- From 2005 to 2010, American children drank an average of 14.5 ounces of water, according to a June 2013 study in the Nutrition Journal.
- From 2011 to 2014, American adults drank an average of 39 ounces of water on a given day, according to a February 2018 study in Public Health Nutrition.
- Plain water intake is lower in younger children, non-Hispanic Black and Mexican-American children, according to the Nutrition Journal study.
- Among American adults, plain water intake is lower in older adults, adults with lower incomes and those with lower education, according to the Public Health Nutrition study.
- American adolescents who drink less water also tend to eat fewer fruits and vegetables, drink more sugar-sweetened beverages and get less physical activity, according to a March 2020 study in the American Journal of Health Promotion.
Nutrition and Disease Statistics
There is a complex network of factors that plays a role in nutrition-related disease risk, including access to food, cost of food and nutrition education. Poor nutrition is linked to a number of chronic diseases, like type 2 diabetes and heart disease. Here's how many Americans are living with health conditions linked to poor nutrition.
- More than half of American adults have diet-related chronic diseases, such as heart disease, type 2 diabetes, obesity and some types of cancer, according to the 2020-2025 Dietary Guidelines for Americans.
- An unhealthy diet is linked to about 678,000 deaths every year in the U.S. because of nutrition- and obesity-related diseases like type 2 diabetes, cancer and heart disease, according to the Center for Science in the Public Interest (CSPI).
- Dietary risks (other than body mass index or BMI) contributed to a greater percentage of American deaths in 2016 than tobacco, high blood pressure, impaired kidney function, low physical activity or alcohol and drug use, according to the CSPI.
- The estimates of annual direct and indirect costs for diseases associated with diet and inactivity (including the portions caused by factors besides diet and physical inactivity) are as follows, according to the CSPI:
Costs of Diseases Associated With Diet and Inactivity
Disease | Cost in Billions |
|---|---|
Diabetes | $245 |
Cancer | $216.6 |
Coronary heart disease | $204.4 |
Obesity* | $190 |
High blood pressure | $46.4 |
Stroke | $36.5 |
Osteoporosis | $19 |
*Estimate of direct medical costs only
Obesity Statistics
Diet can contribute to obesity, especially when paired with too little physical activity. Obesity is a medical condition involving excess body fat, and it raises your risk of other diseases and health problems like heart disease, type 2 diabetes, high blood pressure and certain cancers, according to the Mayo Clinic.
The World Health Organization (WHO) defines overweight as having a BMI equal to or greater than 25 and obesity as having a BMI equal to or greater than 30.
Note: To ensure accuracy, the terms we use below for race and ethnicity reflect the language used in each cited source.
Global Obesity Statistics
- Worldwide, obesity has nearly tripled since 1975, according to the WHO.
- In 2016, more than 1.9 billion adults ages 18 and older had overweight, according to the WHO.
- Globally, 38 million children under the age of 5 had overweight or obesity in 2019, according to the WHO.
- More than 340 million children and adolescents ages 5 to 19 had overweight or obesity in 2016, according to the WHO.
- Of the 1.9 billion adults who had overweight in 2016, over 650 million had obesity, according to the WHO.
- Most of the world's population lives in countries where a greater number of people die from having overweight or obesity than underweight, according to the WHO.
- Adult obesity rates are highest in the United States, Mexico, New Zealand and Hungary. They are lowest in Japan and Korea, per a 2017 report from the Organisation for Economic Co-operation and Development.
Obesity Statistics in the United States
Obesity doubled among adults, tripled in adolescents and quadrupled in children ages 6 to 11 in the U.S. between the early 1970s and 2010, according to the 2010 Dietary Guidelines for Americans.
Obesity Statistics for American Adults
- Today, about 74% of adults have overweight or obesity, according to the 2020-2025 Dietary Guidelines for Americans.
- Adults ages 40 to 59 have the highest rate of obesity (43%) of any age group, according to the 2020-2025 Dietary Guidelines for Americans.
- Adults 60 years and older have a 41% rate of obesity.
- Severe obesity was highest among adults ages 40 to 59 from 2017 to 2018, per the U.S. Department of Health and Human Services (HHS).
- 6.9% of men and 11.5% of women had obesity in 2017 to 2018, according to the CDC.
- From 1999 to 2000 through 2017 to 2018, the age-adjusted prevalence of obesity increased from 30.5% to 42.4%, while the prevalence of severe obesity increased from 4.7% to 9.2% in the U.S., according to the HHS.
Obesity Statistics for American Children and Teens
- About 40% of American children and adolescents have overweight or obesity, and the rate of obesity increases throughout childhood and teen years, according to the 2020-2025 Dietary Guidelines for Americans.
- In the U.S., the prevalence of obesity is higher among Hispanic and non-Hispanic Black children and adolescents as compared to non-Hispanic Asians and white children, according to the 2020-2025 Dietary Guidelines for Americans.
- From 2017 to 2018, an estimated 19.3% of American children and adolescents ages 2 to 19 had obesity, including 6.1% with severe obesity and another 16.1% with overweight, according to the National Center for Health Statistics.
- From 2011 to 2014, the prevalence of obesity among children and adolescents ages 2 to 19 decreased with a greater level of education of the household head, according to a February 2018 Morbidity and Mortality Weekly Report from the CDC. The prevalence of obesity in children was:
- 21.6% if the head of the household was a high school graduate or less.
- 18.3% if the head of the household had some college education.
- 9.6% if the head of the household was a college graduate.
- From 2011 to 2014, the obesity rate was 18.9% among children and adolescents ages 2 to 19 in the lowest income group, 19.9% in the middle-income group and 10.9% in the highest income group, according to the CDC.
Macronutrient Intake Statistics
The body needs macronutrients — aka carbohydrates, proteins and fats — in large amounts because they provide the body with energy (calories), according to Washington State University.
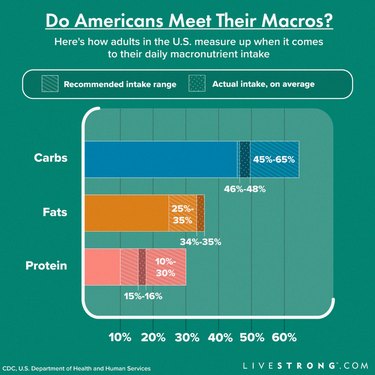
The acceptable macronutrient distribution ranges (AMDR) are 45 to 65 percent of your daily calories from carbs, 25 to 35 percent from fats and 10 to 30 percent from protein, according to the U.S. Department of Health and Human Services, although note that 10 percent of your total calories from protein is the bare minimum and you should aim to eat at the higher end of that range.
The dietary intake of macronutrients for adults aged 20 and over in the United States is as follows, according to the CDC:
Macronutrient | Men | Women |
|---|---|---|
Carbohydrates | 46.4% of total calories | 48.2% of total calories |
Proteins | 16.3% of total calories | 15.8% of total calories |
Fats | 34.6% of total calories | 35.1% of total calories |
Micronutrient Intake Statistics
Vitamins and minerals, often referred to as micronutrients, are essential for healthy development, disease prevention and wellbeing. Worldwide, at least half of children younger than 5 currently have vitamin and mineral deficiencies, according to the CDC.
Most micronutrients are not produced in the body and must come from the diet — and micronutrient deficiencies can result in problematic side effects.
Vitamin D Deficiency
Your body can make vitamin D on its own when you absorb sunlight through your skin, according to the NIH. And because this mostly depends on where you live, having low vitamin D levels is very common worldwide and is associated with weak bones, a weak immune system and a greater risk of certain diseases.
- The prevalence rates of severe vitamin D deficiency are as follows, according to a January 2020 report in the European Journal of Clinical Nutrition:
- 5.9% of the population in the U.S.
- 7.4% of the population in Canada
- 13% of the population in Europe
- Vitamin D levels decline by 22% in winter, according to the European Journal of Clinical Nutrition study.
Vitamin A Deficiency
Children who are deficient in vitamin A, which supports healthy eyesight and immune system functions, have an increased risk of blindness and death from infections such as measles and diarrhea, according to the CDC.
Providing vitamin A supplements to children ages 6 to 59 months is a very effective strategy for reducing deaths from all causes where vitamin A deficiency is a public health concern, according to the WHO.
Vitamin A deficiency affects an estimated 19 million pregnant people and 190 million preschool-age children globally, according to the WHO.
Iron Deficiency
Children and pregnant people are particularly vulnerable to the consequences of iron deficiency. Iron is essential for motor and cognitive development, according to the CDC.
- Iron deficiency is the top cause of anemia, or low hemoglobin concentration. Anemia affects 41% of pregnant people and 44% of children younger than 5 globally, according to a July 2013 study in The Lancet.
- Having anemia during pregnancy raises the risk of death for the mother and low birth weight for the infant. Worldwide, maternal and neonatal deaths total between 2.5 million and 3.4 million each year, according to the study in The Lancet.
Iodine Deficiency
Iodine is necessary during pregnancy and infancy for the infant's healthy growth and cognitive development, according to the CDC.
- An estimated 1.88 billion people globally have insufficient iodine intake, and iodine content in most foods and beverages is low, according to an April 2012 study in The Journal of Nutrition.
- Fortifying salt with iodine is one strategy that helps. About 86% of households worldwide consume iodized salt, according to the Iodine Global Network.
Zinc Deficiency
Zinc helps people avoid infectious diseases like diarrhea, pneumonia and malaria, and it's also needed for healthy pregnancies, according to the CDC.
- Worldwide, 17.3% of the population is at risk of not getting enough zinc in their diets, according to a November 2012 study in PLOS One.
- Up to 30% of people are at risk of zinc deficiency in some regions of the world. Zinc supplements can reduce the incidence of premature birth, decrease childhood diarrhea and respiratory infections, lower the number of deaths from all causes and increase growth and weight gain among infants and young children, according to the PLOS One study.
Nutrition at Birth and in School in the U.S.
Good nutrition starts at birth. Breastfeeding has many known health benefits for the child and mother, however, infant formulas are a nutritious and perfectly acceptable alternative to breast milk for people who aren't able to or choose not to breastfeed.
The American Academy of Pediatrics and CDC recommend mothers breastfeed or use infant formula exclusively for about the first 6 months, followed by breastfeeding or using infant formula while introducing complementary foods for at least 2 years.
Nutrition continues in schools, where it's important for students to have access to nourishing foods during their education. Schools have an important role to play in helping students develop healthy eating behaviors by providing nutritious and appealing foods and drinks, consistent and accurate messages about good nutrition and ways to learn about and practice healthy eating, according to the CDC.
- 84.1% of infants born in 2017 were breastfed at some point, 58.3% were breastfed at 6 months and 35.3% were breastfed at 12 months, according to the CDC.
- The percentage of breastfed infants who were supplemented with infant formula before 2 days of age was 19.2% among those born in 2017, an increase from 16.9% among those born in 2016, according to the CDC.
- 47 states have adopted a policy to support farm-to-school or farm-to-Early Care and Education (ECE) systems from 2002 to 2017 to provide students with more access to locally grown food, according to the CDC.
- 42% of school districts participate in farm-to-school programs, according to the CDC.
- A median of 44.8% of middle and high schools offer a salad bar for students across 48 states and D.C., according to the CDC.
- American students receive fewer than 8 hours of required nutrition education every school year, according to the CDC. For reference, 40 to 50 hours of education are needed to affect behavior change.
- Between 2000 and 2014, the percentage of schools that provided required instruction on nutrition and dietary behaviors decreased from 84.6% to 74.1%, according to the CDC.


- U.S. Department of Agriculture: "2020 - 2025 Dietary Guidelines for Americans"
- Mayo Clinic Proceedings: "Healthy Lifestyle Characteristics and Their Joint Association With Cardiovascular Disease Biomarkers in US Adults"
- Gallup: "Vermont No. 1 in Frequent Exercise, Produce Consumption"
- U.S. Centers for Disease Control and Prevention: "Disparities in State-Specific Adult Fruit and Vegetable Consumption — United States, 2015"
- Journal of the Academy of Nutrition and Dietetics: "Percentage of youth meeting federal fruit and vegetable intake recommendations, Youth Risk Behavior Surveillance System, United States and 33 states, 2013"
- Center for Science in the Public Interest: "Why Good Nutrition is Important"
- Institute for Health Metrics and Evaluation: "United States of America"
- Mayo Clinic: "Coronary artery disease"
- Mayo Clinic: "Obesity"
- World Health Organization: "Obesity and overweight"
- U.S. Department of Health and Human Services: "2010 Dietary Guidelines for Americans"
- U.S. Department of Health and Human Services: "Prevalence of Obesity and Severe Obesity Among Adults: United States, 2017–2018"
- Office of Disease Prevention and Health Promotion (ODPHP): "Nutrition, Physical Activity, and Obesity"
- National Center for Health Statistics: "Prevalence of Overweight, Obesity, and Severe Obesity Among Children and Adolescents Aged 2–19 Years: United States, 1963–1965 Through 2017–2018"
- U.S. Centers for Disease Control and Prevention: "Prevalence of Obesity Among Youths by Household Income and Education Level of Head of Household — United States 2011–2014"
- U.S. Centers for Disease Control and Prevention: "Obesity Among WIC-Enrolled Young Children"
- Morbidity and Mortality Weekly Report: "State-Specific Prevalence of Obesity Among Children Aged 2–4 Years Enrolled in the Special Supplemental Nutrition Program for Women, Infants, and Children — United States, 2010–2016"
- World Health Organization: "Data and Statistics"
- U.S. Centers for Disease Control and Prevention: "Get the Facts: Added Sugars and Consumption"
- Journal of the American Dietetic Association: "Dietary sources of energy, solid fats, and added sugars among children and adolescents in the United States"
- Harvard T.H. Chan School of Public Health: "Salt and Sodium"
- Institute of Medicine of the National Academies: " Improving Food Safety Through a One Health Approach"
- U.S. Food & Drug Administration: "You May Be Surprised by How Much Salt You're Eating"
- Advances in Nutrition: "A Perspective on the Transition to Plant-Based Diets: a Diet Change May Attenuate Climate Change, but Can It Also Attenuate Obesity and Chronic Disease Risk?"
- Gallup: "Snapshot: Few Americans Vegetarian or Vegan"
- Mintel: "Meat-Free Days Is the Top Reason For Eating Protein Alternatives Among US Consumers"
- United States Department of Agriculture: "Food Availability and Consumption"
- Economic and Social Research Institute: "An Estimate of the Number of Vegetarians in the World"
- Washington State University: "Nutrition Basics"
- U.S. Centers for Disease Control and Prevention: "Diet/Nutrition"
- The Lancet: "Global, regional, and national trends in haemoglobin concentration and prevalence of total and severe anaemia in children and pregnant and non-pregnant women for 1995–2011: a systematic analysis of population-representative data"
- World Health Organization: "Guideline: vitamin A supplementation in infants and children 6-59 months of age"
- The Journal of Nutrition: "Global Iodine Status in 2011 and Trends over the Past Decade"
- Iodine Global Network: "What is being done internationally about iodine deficiency?"
- PLOS One: "Estimating the Global Prevalence of Zinc Deficiency: Results Based on Zinc Availability in National Food Supplies and the Prevalence of Stunting"
- U.S. Centers for Disease Control and Prevention: "Nutrition Education in US Schools"
- U.S. Centers for Disease Control and Prevention: "Breastfeeding Report Card"
- U.S. Centers for Disease Control and Prevention: "Estimates of Foodborne Illness in the United States"
- U.S. Department of Agriculture: "Food Access"
- U.S. Department of Agriculture: "Household Food Security in the United States, 2008"
- United States Census Bureau: "Section 3. Health and Nutrition"
- U.S. Department of Agriculture: "ERS Charts of Note"
- Advances in Nutrition: "State Indicator Report on Fruits and Vegetables, 2013, Centers for Disease Control and Prevention, Atlanta, GA"
- U.S. Centers for Disease Control and Prevention: "2018 State Indicator Report on Fruits and Vegetables"
- U.S. Centers for Disease Control and Prevention: "Get the Facts: Drinking Water and Intake"
- Academy of Nutrition and Dietetics: "How Much Water Do You Need"
- Nutrition Journal: "Water and beverage consumption among children age 4-13y in the United States: analyses of 2005–2010 NHANES data"
- Public Health Nutrition: "Disparities in plain, tap and bottled water consumption among US adults: National Health and Nutrition Examination Survey (NHANES) 2007–2014"
- American Journal of Health Promotion: "Correlates of Infrequent Plain Water Intake Among US High School Students: National Youth Risk Behavior Survey, 2017"
- United States Department of Agriculture: "U.S. Trends in Food Availability and a Dietary Assessment of Loss-Adjusted Food Availability, 1970-2014"
- U.S. Centers for Disease Control and Prevention: "Fast Food Consumption Among Adults in the United States, 2013–2016"
- Organisation for Economic Co-operation and Development: "Obesity Update 2017"
- American Journal of Public Health: "Food Insecurity During COVID-19: An Acute Crisis With Long-Term Health Implications"
- CDC: "How Much and How Often to Feed Infant Formula"
- Fourth: "Truth About Dining Out"
- American Academy of Pediatrics: "Policy Statement: Breastfeeding and the Use of Human Milk "