Cycling has been experiencing a bit of a renaissance, with many people considering more time-efficient and eco-friendly modes of transportation than cars, buses and trains.
The global market for bicycles is estimated to grow to $34.6 billion by 2027, according to a July 2020 report by market research firm Global Industry Analysts, Inc.
Video of the Day
Video of the Day
But exactly how many people are biking in the U.S. and around the world these days? What are the most popular types of bikes? And how common are biking accidents? Keep scrolling to learn all these cycling statistics and more.
Global Cycling Statistics
Cycling is a relatively inexpensive activity and mode of transportation, so it's no surprise it's popular around the world. In fact, biking statistics show that cycling has become a popular way to commute and run errands, which makes sense, given it's reliable and, sometimes, the fastest way to get around.
- Globally, cyclists who rode at least one 100-mile ride increased by 22 percent, according to Strava's 2023 Year in Sport Data Report.
- 42% of households around the world own at least one bicycle — that's more than 580 million bicycles worldwide, according to a December 2015 study in the Journal of Transport & Health.
- About 7% of urban trips worldwide are completed with a bike, according to a 2014 report by the Institute for Transportation & Development Policy (ITDP).
- Up to 60% of all urban trips are made by bike in Chinese cities, according to the United Nations (UN) Environment Programme.
- More than 600 cities worldwide have their own bike-share systems, with more programs launching every year. The largest bike-share systems are in Chinese cities, including Hangzhou and Shanghai, according to the ITDP.
- 2 billion bikes (or more) are being used around the world, according to the World Economic Forum (WEF), and that number could rise to 5 billion by 2050.
- The Netherlands has the most bicycles per capita in the world, according to the WEF.
- 52% of residents in Copenhagen — considered the most bike-friendly city in the world — use a bike to commute, according to the WEF.
Biking and Environmental Statistics
Although riding a bike probably isn't faster than driving a car (unless you're stuck in traffic, of course), it's definitely a more cost-effective, environmentally friendly alternative.
Transportation from cars, trucks and trains accounts for 27 percent of U.S. greenhouse gas emissions, making it the largest contributor, according to the Environmental Protection Agency (EPA), but because bikes don't require fossil fuel, they don't release nearly as much greenhouse gases into the atmosphere.
- Swapping your car for a bike saves about 150 grams of carbon dioxide (CO2) per kilometer (that's about 240 grams of CO2 per mile), according to the UN Environment Programme.
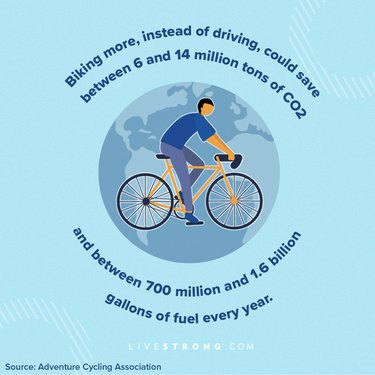
- A car emits about 8,887 grams of CO2 per gallon of gasoline, according to the EPA. Each year, a typical car will release about 4.6 tons of carbon dioxide. Biking could save between 6 and 14 million tons of CO2, according to the non-profit Adventure Cycling Association.
- Bicycling could also save between 700 million and 1.6 billion gallons of fuel yearly, according to the Adventure Cycling Association.
- A 20% increase in biking around the world could cut urban travel-induced CO2 emissions by nearly 11% by 2050, according to the ITDP.
- Bike share systems in 8 cities across the U.S. reduced annual CO2 emissions between 41 and 5,417 tons, according to a February 2020 study in Resources, Conservation and Recycling.
Related Reading
Bicycle Accident Statistics
Although bike safety stats may be a little alarming, knowing how accidents happen can help you stay safe behind the handlebars. Always wear a helmet, ride a bike that fits you, drive with the flow of traffic, obey the rules of the road and, when possible, ride during the day, per the National Highway Traffic Safety Administration (NHTSA).
- 2% of total car crash deaths in the U.S. are bicyclists, according to the Insurance Institute for Highway Safety. In most fatal crashes, bicyclists experienced a head injury, which is why wearing a helmet is crucial.
- About 857 total bicyclists were killed in traffic accidents in 2018 (the most recent year from which data is available), according to the 2018 motor vehicle crash report from the U.S. Department of Transportation (DOT).
- 51 more bicycle deaths occurred in 2018 than in 2017 (which saw a total of 806 deaths), according to the DOT.
- Bicycle deaths rose 5% from 2020 to 2021, according to the NHTSA.
- About 79% of 2018 fatal bicycle/car crashes took place in urban areas, according to the NHTSA.
- The male death rate was about 7 times higher per million people, according to the NHTSA.
- The male injury rate in 2018 was about 5 times higher per million people, according to the NHTSA.
- About 37% of all fatal crashes in 2018 were related to alcohol consumed by either the car driver or cyclist, according to the NHTSA.
- 25% of cyclist deaths occurred as drivers tried to overtake bike lanes between intersections, according to the National Transportation Safety Board.
- The severity of a cyclist's injuries in a crash increases as the speed limit increases, according to The Royal Society for the Prevention of Accidents.
- E-bike-related injuries are 3 times more likely to involve colliding with a pedestrian versus colliding with another bike or powered scooter, according to an October 2019 study in Injury Prevention.
Bicycle Helmet Statistics
One easy way to reduce the severity of injury while biking is to wear a helmet. Nevertheless, cycling safety stats suggest bikers don't wear helmets often enough. Of the 76,032 bicyclists with head or neck injuries surveyed in the 2002-2012 National Trauma Data Bank, only 22 percent wore a helmet, according to a January 2019 study in Brain Injury. Think twice before you leave your helmet at home.
- Only 21% of men who suffered head or neck injuries wore a helmet while biking, according to the Brain Injury study.
- Only 28% of women who experienced a head or neck injury while biking wore a helmet, the research also found.
- Only 12% of children under the age of 17 who suffered a head or neck injury while biking wore a helmet.
- Only about 6% of Black cyclists wore a helmet while on the bike.
- Only about 7.6% of Hispanic cyclists wore a helmet while biking.
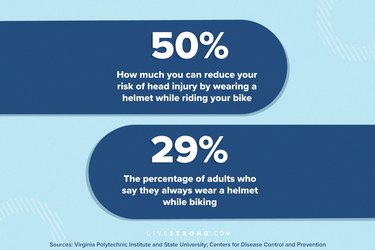
- Wearing a helmet while riding your bike can reduce your risk of head injury by more than 50%, according to Virginia Polytechnic Institute and State University.
- Only 29% of adults and 42% of kids surveyed in a 2012 Centers for Disease Control and Prevention (CDC) report always wore a helmet while biking, according to a December 2016 study in the Journal of Safety Research.
Related Reading
Bicycle Statistics by Sex
In the past, cycling was a sport dominated by people assigned male at birth, with people assigned female at birth making up only about 24% of all bicycle trips in the U.S. in 2009, according to the National Household Travel Survey. (The research in this area categorizes people as men and women.) Men historically traveled, on average, 10 more miles per day than women. But today, the gap between male and female cyclists is narrowing.
- Of the 103 million people who rode a bike in 2020, 26% were women and about 39% were men, according to a survey conducted by the PeopleforBikes Foundation.
- 66% of American women believe their communities would be improved if cycling was a safer activity, according to an August 2013 report by the League of American Bicyclists (LAB).
- 60% of bicycle owners between the ages of 17 and 28 are women, according to the LAB report.
- More than 40% of women in two-person households with small kids include non-work-related trips in their commute, according to the LAB.
- 6% of women in the U.S. claim they're comfortable riding on all roads with traffic versus 13% of men, according to the LAB.
- 58% of women in the U.S. feel very confident riding a bike, whereas 81% of men feel very confident riding, according to the LAB.
- 66% of women make twice as many trips to drop off and pick up their kids than their male partners, according to the LAB.
Bicycle Statistics by Ethnicity and Race
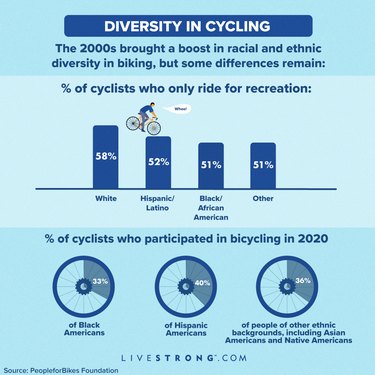
In the early 2000s, the world of biking saw a boost in racial and ethnic diversity, as more minority groups began riding for both recreational and transportation purposes.
- Between 2001 and 2009:
- The percentage of trips taken by bike, among African Americans increased 100%, according to the LAB. (The report categorized people as African American, Asian American, Hispanic and white.)
- The percentage of trips taken by bike among Asian Americans grew by 80%.
- The percentage of trips taken by bike among Hispanics grew by 50%.
- Approximately 33% of Black Americans participated in bicycling in 2020, according to the PeopleforBikes Foundation.
- Approximately 40% of Hispanic Americans participated in bicycling in 2020.
- Approximately 36% of people of other ethnic backgrounds, including Asian Americans and Native Americans, participated in bicycling in 2020.
Support Diversity in Cycling With These Groups
Bike Speed Statistics
Different types of bikes have varying gears and speeds for different goals and needs. But understanding general cycling speed trends and regulations in your area can help prevent accidents and injuries, keeping you safe on the road and on designated cycling paths.
- The average bicycle speed on bike-specific paths generally ranges between 12.5 km/h and 26.5 km/h (or 7.7 mph to 16.4 mph), according to a Swedish September 2019 study in Traffic Injury Prevention.
- The presence of cyclists on the road doesn't generally encourage car drivers to slow down on urban roads without bike lanes, according to a July 2020 study in Transportation Research Record: Journal of the Transportation Research Board.
- The fastest bike speed ever recorded is 183.9 mph, set by Denise Mueller-Korenek in 2018, according to Guinness World Records.
Professional Cycling Statistics
Cycling is one of the most celebrated sports in the world. Taking a look at professional cycling records can inspire you to improve your own bike game and give you a broader perspective of what's possible.
National Men's Cycling Records
- James Mellen holds the national 200m flying start (where cyclists can move with their bikes, as opposed to starting standing still) record at 9.598 seconds, according to USA Cycling.
- Aaron Miller holds the national 250m flying start record at 12.642 seconds.
- Ethan Boyes holds the national 500m flying start record at 26.461 seconds.
- David Espinoza holds the national 250m standing start record at 17.659 seconds.
- Eric Young holds the national 1,000m standing start record at 59.563 seconds.
- Ashton Lambie holds the national 4,000m standing start record at 4:05 minutes.
- Tom Zirbel holds the national 1-hour standing start record with a distance of 53.037 km.
National Women's Cycling Records
- Madalyn Godby holds the national 200m flying start record at 10.555 seconds.
- Jennifer Valente holds the national 250m flying start record at 13.794 seconds.
- Jennie Reed holds the national 500m flying start record at 29.662 seconds.
- Madalyn Godby holds the national 250m standing start record at 19.416 seconds.
- Mandy Marquardt holds the national 500m standing start record at 34.46 seconds.
- Mandy Marquardt holds the national 1km standing start record at 1:08 minutes.
- Chloe Dygert holds the national 3km standing start record at 3:16 minutes.
- Evelyn Stevens holds the national 1-hour standing start record with a distance of 47.980 km.
- It's estimated that Peter Sagan, the highest-earning pro cyclist for team Bora-Hansgrohe earned about €5 million in 2020 (about $6 million), according to Pro Cycling UK.
- Tadej Pogačar has reputedly the highest-paid contract in pro cycling, although his net worth is unknown, according to Pro Cycling UK.
- About 2.3 million euros are awarded to the teams and riders in the Tour de France, according to the official Tour de France website.
- The 2023 Tour de France route was 3,405.6 km (or 2,116 miles), according to the Tour de France website.
- The individual classification winner of the Tour de France wins a prize of $500,000. For the Tour de France Femmes, which was the competition's second year, the total prize for the winner was $54,814, according to Bicycling magazine.
- Daniel Teklehaimanot was the first sub-Saharan African athlete to wear the Best Climber's jersey at the Tour de France in 2015, according to the Union Cycliste Internationale.
- Nicholas Paul became the male world record holder of the 200m flying start in 2019, finishing in 9.100 seconds at the Pan-American Track Cycling Championships in Bolivia, according to the Guinness World Records.
- Kelsey Mitchell became the female world record holder of the 200m flying start in 2019, finishing in 10.154 seconds at the Pan-American Track Cycling Championships in Bolivia, according to the Guinness World Records.
Bicycle Commuting Statistics
The idea of biking to work is still relatively new to people. But as climate change becomes a bigger concern, and amid fears of COVID-19, recent cycling statistics predict more bikers on the road, whether it's for commuting or for recreation.
- About 870,000 people in the U.S. commute to work by bicycle — that's 0.6% of all workers in the country, according to the U.S. Census Bureau.
- 1.1% of commuters in big cities get to work by bike, according to the Census Bureau.
- Outside of metropolitan areas, only 0.3% of workers commute by bike.
- 1% of workers between the ages of 16 to 24 use their bike to get to work.
- 0.7% of workers between the ages of 25 to 44 commute to work by bike.
- Only 0.4% of workers 45 and older get to work by bike.
Biking Health Statistics
Although cycling has its risks, it also has more than a few health benefits that make it an excellent form of exercise. However, your biking intensity (not duration) has the biggest influence on your health.
- Cycling intensely is linked to a longer life expectancy, according to a February 2011 study of 5,000 cyclists in the European Journal of Preventative Cardiology.
- The men in the study who cycled most briskly lived about 5.3 years longer than men with low cycling intensity, while women who biked at a quick pace lived about 3.9 years longer than women who rode slowest.
- The men who cycled at an average-level intensity lived about 2.9 years longer than men with low-cycling intensity, whereas the women who cycled at average speed lived about 2.2 years longer than women who rode slowest.
- Biking to work is associated with a lower risk of coronary heart disease, obesity and type 2 diabetes in middle-aged adults who commute by bike, according to a November 2016 cohort study published in Circulation.
Bicycle Lane Statistics
The availability of designated bike lanes affects the overall safety of cycling in a specific area. Choosing routes with bike paths or lanes can help keep you safe when you're on the road.
- Busy streets with separate, designated bike lanes have the lowest associated injury risk, according to a December 2012 study in the American Journal of Public Health.
- The risk of injury on busy streets is lower if there are no cars parked on the road, according to the above-mentioned study.
- About 25% of the population in the U.S. has access to either bike lanes or paths in the areas where they live or ride, according to the U.S. Bureau of Transportation Statistics (BTS).
- The percentage of cyclists who don't feel safe biking dropped 10% in areas where bike paths or lanes are available, according to a 2002 national survey of 9,616 people conducted by the BTS.
- The percentage of cyclists who don't feel safe increased by about 17% when bike paths and lanes are unavailable, the research found.
- More than 50% of American women say more bike lanes and bike paths would encourage more cycling, according to the LAB.
Top Bicycle Brands
Bicycling magazine, a leading publication in the field of cycling, names bikes from these 10 brands (presented here in alphabetical order) among its best bikes of 2023:
- Cannondale
- Canyon
- Cervelo
- Denago
- Enve
- Fuji
- Pinarello
- Specialized
- Trek
- Yeti
Related Reading
- Journal of Transport & Health: "Tracking Global Bicycle Ownership Patterns"
- Global Industry Analysts, Inc: "Bicycles - Global Market Trajectory & Analytics"
- World Economic Forum: "Why We Need to Encourage Cycling Everywhere"
- National Household Travel Survey: "2009 National Household Travel Survey"
- Insurance Institute for Highway Safety: "Bicyclists"
- US Department of Transportation: "2018 Fatal Motor Vehicle Crashes: Overview"
- National Highway Traffic Safety Administration: "Bicyclists and Other Cyclists"
- European Journal of Preventative Cardiology: "Intensity Versus Duration of Cycling, Impact on All-Cause and Coronary Heart Disease Mortality: the Copenhagen City Heart Study"
- National Transportation Safety Board: "NTSB Says Changes to Roadway Design, Collision Avoidance Systems, More Helmet Use Needed to Address Increase in Bicyclist Fatalities"
- Guiness World Records: "A History of Cycling Speed Records as Denise Mueller-Korenek Reaches 183 mph"
- Circulation: "Prospective Study of Bicycling and Risk of Coronary Heart Disease in Danish Men and Women"
- Union Cycliste Internationale: "
- USA Cycling: "National Records"
- Tour de France: "Sporting Stakes"
- Pro Cycling UK: "How Much do Pro Cyclists Earn?"
- Resources, Conservation and Recycling: "Quantifying Greenhouse Gas Emissions Reduction From Bike Share Systems: a Model Considering Real-World Trips and Transportation Mode Choice Patterns"
- Guinness World Records: "Fastest Cycle 200 m Unpaced Flying Start (Male)"
- Guinness World Records: "Fastest Cycle 200 m Unpaced Flying Start (Female)"
- Injury Prevention: "Injuries Associated With Electric-Powered Bikes and Scooters: Analysis of U.S. Consumer Product Data"
- EPA: "Sources of Greenhouse Gas Emissions"
- Tour de France: "2022 ROUTE"
- Bicycling: "The Best Road-Enhancing, Dirt-Boosting, Gravel-Roosting Bikes You Can Buy Right Now"
- Environmental Protection Agency: "Greenhouse Gas Emissions from a Typical Passenger Vehicle"
- Adventure Cycling Association: "Environmental Impact"
- National Highway Traffic Safety Administration: "Early Estimates of Motor Vehicle Traffic Fatalities And Fatality Rate by Sub-Categories in 2021"
- PeopleforBikes Foundation: "Bicycling Participation Study: "2020 Survey of U.S. Residents"