Swimming deserves much, much more recognition as a top-tier cardio workout than it currently receives. Sure, running and cycling are great, but when it comes to low-impact exercise that's as good for you as it feels, swimming is second to none.
But when it comes to taking a plunge, how many kids and adults actually know how to swim? How common are swimming pool accidents and drownings? And is Olympian Michael Phelps the fastest swimmer in the world?
Video of the Day
Video of the Day
Dive into these important swimming statistics to learn about this open-water and pool sport.
Global Swimming Statistics
Professional sports like running, cycling and football (soccer in the U.S.) often get the limelight on the global stage. But the percentages of swimmers in different regions of the world show that the recreational activity is more universal — for adults and children alike — than you might think.
Note: The terms below used to represent gender are from the original sources cited.
- Roughly 2,984,880 adults above the age of 15 in Australia swim (that's about 14.8% of the population above 15), according to the Australian Sports Commission's 2019 State of Play Report.
- More than 56% of participants were female.
- 1.5 million children in Australia participated in some form of organized swimming.
- About 3.8 million adults in England participated in at least two swims in November 2022, which is up by 1.8 million people from the previous year, according to Sport England's Active Lives Adult Survey November 2021-2022.
- Swim instructors in England spent about 59,631 teaching hours giving children's lessons in December 2017, according to Swim England, the country's governing body for swimming.
- More than 6 million residents and visitors went to swimming pools in Singapore in 2018, according to Singapore in Figures 2019, a report conducted by the Department of Statistics in Singapore.
U.S. Swimming Statistics
Although these swimming stats show many Americans haven't actually taken official lessons, swimming is one of the most popular sports in the U.S.
- Swimming is the fourth most popular recreational sport in the country, according to the Centers for Disease Control and Prevention (CDC), after walking, running and cycling.
- About 91 million Americans (about 31% of the population) over the age of 16 swim in oceans, lakes and rivers each year.
- About 36% of children 7 to 17 years old swim at least six times each year.
- About 15% of adults swim at least six times each year.
- There are more than 3,100 professional swimming clubs, which include more than 400,000 members, according to USA Swimming, the national governing body for swimming in the country.
- The rates of private swimming lessons from a professional vary by region, according to the American Red Cross' May 2014 Water Safety Poll.
- Midwest: 7%
- South: 14%
- Rural areas: 44%
- Urban areas: 55%
- Suburban areas: 54%
- Midwest: 7%
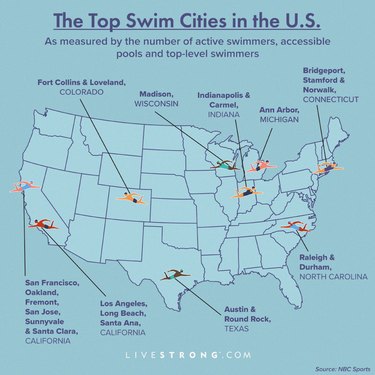
- According to NBC Sports, the top U.S. swim cities — measured by the number of active swimmers, accessible pools and top-level swimmers — include:
- Ann Arbor, Michigan
- San Jose-Sunnyvale-Santa Clara, California
- Raleigh-Durham, North Carolina
- Bridgeport-Stamford-Norwalk, Connecticut
- San Francisco-Oakland-Fremont, California
- Fort Collins-Loveland, Colorado
- Madison, Wisconsin
- Austin-Round Rock, Texas
- Los Angeles-Long Beach-Santa Ana, California
- Indianapolis-Carmel, Indiana
Swimming Statistics by Sex
Swimming, like many other sports, typically puts participants into female or male categories, which is why we use the terms "women" and "men" below. Men tend to outpace women in many sports, but the gender gap in swimming is smaller than ever.
- 43% of women have taken swimming lessons from a certified instructor, according to the American Red Cross.
- 34% of men have taken lessons.
- 44% of men say they taught themselves how to swim.
- 29% of women say they taught themselves how to swim.
- U.S. diving was the only sport at the 2012 Olympic games that had 50% female and 50% male participation, according to a report created by the SHARP Center for Women & Girls, an organization dedicated to helping women and girls become more active and healthy.
- Synchronized swimming had 100% female participation.
- Swimming had 47.5% female participation.
- 54.2% of USA Swimming athletes identify as female, according to USA Swimming.
Related Reading
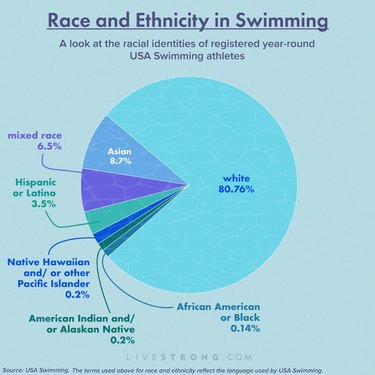
Swimming Statistics by Ethnicity and Race
Drowning death rates for Black people are 1.5 times higher than the rates for white people, according to the CDC. (The Red Cross report categorized people as African American and white. To ensure accuracy, the terms we use below for race and ethnicity reflect the language used in each cited source.)
- 55% of African Americans have taken group or private swimming lessons from an instructor, friend or relative, according to the American Red Cross.
- 23% of African Americans have taken swimming lessons from a friend or relative.
- 27% of African Americans are self-taught swimmers.
- 64% of African American children have little to no swimming ability, according to USA Swimming, compared to:
- 45% of Hispanic/Latino children
- 40% of white children
- Black children (age 10 to 14) have 7.6 times higher drowning rates than white children, and they are more likely to drown in public pools while white children are more likely to drown in residential pools, according to the CDC.
- Only 0.14% of registered year-round USA Swimming athletes identify as African American or Black, according to USA Swimming.
- 0.2% identify as American Indian and/or Alaskan Native
- 0.2% identify as Native Hawaiian and/or other Pacific Islander
- 3.5% identify as Hispanic or Latino
- 6.5% identify as mixed race
- 8.7% identify as Asian
- At the 2016 Rio Olympic Games, Simone Manuel became the first Black American woman to win an Olympic gold medal in swimming, according to Team USA.
- In 2004, Maritza Correia became the first Puerto Rican woman of African American descent to win an Olympic medal in swimming, per USA Swimming.
- Anthony Ervin was the first African American man to make the U.S. Olympic swim team. He was also the first African American man to win a gold medal at the 2000 Sydney games.
Groups That Support Diversity in Swimming
Statistics About Swimming Benefits
Aside from instantly cooling you down on a hot day, the health benefits of swimming include improving your cardiovascular endurance, promoting weight loss and protecting your joints.
- Swimming for just an hour three times per week can have a positive effect on your heart health, weight loss and flexibility, according to an October 2015 Journal of Exercise Rehabilitation study.
- After swimming for 30 minutes, a 155-pound person will burn about 223 calories, according to Harvard Health Publishing. Here's how many calories the same person would burn doing 30 minutes of the following swim strokes:
- Backstroke: 298
- Breaststroke: 372
- Butterfly: 409
- Crawl (or freestyle): 409
- Vigorous swimming: 372
- Treading water vigorously: 372
- Swimming for 45 minutes three days a week improved joint pain and stiffness in patients with osteoarthritis in a small March 2016 Journal of Rheumatology study.
- After tracking more than 80,000 adults for more than 20 years, researchers found that swimming was associated with a reduced risk of dying from heart disease in a May 2017 British Journal of Sports Medicine study.
- Adults who swam had a 28% lower risk of all-cause death.
- Adults who swam had a 41% lower risk of death from heart concerns.
- Being in water makes you more buoyant by reducing 90% of your weight, which makes swimming a low-impact exercise that's easier on your joints, bones and muscles, according to the American Council on Exercise (ACE).
Statistics About Swimming Risks
Swimming is a safe, effective and relaxing workout, but it comes with some risks. These injury and drowning stats bring to light the importance of practicing water safety and being extra cautious when monitoring young children swimming under your care.
Swimming Injury Statistics
- 40 to 91% of swimming injuries occur in the shoulders, according to a May 2012 Sports Health study.
- After observing 38 competitive swimmers, authors of a September 2013 The Pain Clinic study found that 13 of the men experienced shoulder pain.
- 7 of the men had lower back pain.
- 3 of the men had knee pain.
Drowning Statistics
- Every year from 2012 to 2021, there were an average of 4,083 unintentional drownings deaths (including boating) annually in the U.S., according to the CDC.
- 88% of child drownings happen in the presence of at least one adult, according to Stop Drowning Now, a swimming educational platform.
- Most drownings occur in children between the ages of 1 to 4, according to the CDC.
- Drowning is the third leading cause of unintentional injury death globally, according to a 2021 report from the World Health Organization (WHO).
- In 2019, there were about 236,000 deaths from drowning worldwide.
- 90% of unintentional drowning deaths occur in middle- and lower-income countries.
- Drowning death rates are highest in the WHO Western Pacific Region, which includes Australia, China, the Philippines, Japan and Fiji, and are 27 to 32 times higher than drowning death rates in the UK and Germany.
- The highest drowning rates worldwide are among 1- to 4-year-old children.
- Coastal drowning in the U.S. accounts for about $273 million in costs each year.
- In 2012, about 20% of drowning cases around the world happened in the WHO's Africa region, according to January 2018 research in the South African Medical Journal.
- Alcohol use plays a role in up to 70% of deaths associated with water recreation among adolescents and adults each year, according to the CDC.
- Nearly 25% of drowning-related emergency room visits each year involve alcohol.
- 72% of boating deaths in 2010 were caused by drowning.
- 88% of people who drown boating weren't wearing life jackets.
- Alcohol plays a role in 1 in 5 boating deaths each year.
Swimming Speed Statistics
Take a look at some average swimming speed benchmarks and see where your skills stand. Keep in mind swimming pace varies by distance; for example, someone swimming 100 meters will swim faster than someone swimming a mile.
- The average pace for a 100-meter swim is about 2 minutes, according to U.S. Masters Swimming, which is about 1.8 miles per hour (mph).
- The same person could swim:
- 200 meters in about 4 minutes
- 500 meters in about 10 minutes
- 1,500 meters in about 30 minutes
- The fastest recorded speed for Michael Phelps, the fastest swimmer in the world, is 6 mph, according to ESPN.
- The first individual to complete a consecutive double crossing of the North Channel was Sarah Thomas in 21 hours, 46 minutes, 38 seconds in July 2022, according to [Guinness World Records](https://www.guinnessworldrecords.com/world-records/710964-fastest-two-way-swim-crossing-of-the-north-channel#:~:text=Endurance%20swimmer%20Sarah%20Thomas%20(USA,crossing%20of%20the%20North%20Channel.).
- Thomas also crossed the English Channel 4 times consecutively after receiving breast cancer treatment, according to BBC.
- The fastest swim to across the Leme Pontal (in Rio De Janeiro, Brazil) was completed by Glauco de Oliveira Rangel in 7 hours, 14 minutes in October 2018, according to Guinness World Records.
- The fastest swim across the Persian Gulf was completed by Mohammad Kobadi in 84 days in March 2012, according to Guinness World Records.
- The fastest swim across the Catalina Channel — a 28.5-mile race in California — was completed by Hank Wise in about 7 hours, 55 minutes, 6 seconds in October 2018 according to Swim Catalina.
Competitive Swimming Statistics
The U.S. is home to some of the fastest and most skilled swimmers in the world, but they aren't the only ones breaking records. Other athletes from U.K., France, Sweden, China and Hungary lead the pack.
NCAA Swimming Statistics
According to the National Collegiate Athletic Association (NCAA), these are the current records for Division 1 collegiate-level swimming.
Freestyle Records
- 50-yard freestyle:
- Men: Caleb Dressel, 17 seconds, 63 milliseconds (2018)
- Women: Gretchen Walsh, 20 seconds, 83 milliseconds (2023)
- 100-yard freestyle:
- Men: Dressel, 39 seconds, 90 milliseconds (2018)
- Women: Simone Manuel, 45 seconds, 56 milliseconds (2017)
- 200-yard freestyle:
- Men: Dean Farris, 1 minute, 29 seconds, 15 milliseconds (2019)
- Women: Missy Franklin, 1 minute, 39 seconds, 10 milliseconds (2015)
- 500-yard freestyle:
- Men: Kieran Smith, 4 minutes, 6 seconds, 32 milliseconds (2020)
- Women: Katie Ledecky, 4 minutes, 24 seconds, 6 milliseconds (2017)
- 1,000-yard freestyle:
- Men: Clark Smith, 8 minutes, 33 seconds, 93 milliseconds (2015)
- Women: Ledecky, 9 minutes, 8 seconds, 4 milliseconds (2016)
- 1,650-yard freestyle:
- Men: Bobby Finke, 14 minutes, 21 seconds, 8 milliseconds (2020)
- Women: Ledecky, 15 minutes, 3 seconds, 31 milliseconds (2017)
Backstroke Records
- 100-yard backstroke:
- Men: Luca Urlando, 43 seconds, 35 milliseconds (2022)
- Women: Katharine Berkoff, 48 seconds, 74 milliseconds (2022)
- 200-yard backstroke:
- Men: Murphy, 35 seconds, 73 milliseconds (2016)
- Women: Beata Nelson, 1 minute, 47 seconds, 24 milliseconds (2019)
Breaststroke Records
- 100-yard breaststroke:
- Men: Ian Finnerty, 59 seconds, 69 milliseconds (2018)
- Women: Lilly King, 55 seconds, 73 milliseconds (2019)
- 200-yard breaststroke:
- Men: Leon Marchand, 1 minute, 47 seconds, 67 milliseconds (2023)
- Women: Kate Douglass, 2 minutes, 1 seconds, 43 milliseconds (2023)
Butterfly Records
- 100-yard butterfly:
- Men: Dressel, 42 seconds, 80 milliseconds (2018)
- Women: Douglass, 48 seconds, 84 milliseconds (2023)
- 200-yard butterfly:
- Men: Jack Conger, 1 minute, 37 seconds, 35 milliseconds (2017)
- Women: Ella Eastin, 1 minute, 49 seconds, 51 milliseconds (2018)
U.S. 2020 Olympic Swimming Statistics
These are the gold medals that the U.S. swimming team brought home in the most recent Summer Olympics, the 2020 Tokyo Olympic Games, according to the Olympics website.
Freestyle Gold Medals
- 50-meter freestyle, men: Caleb Dressel
- 100-meter freestyle, men: Dressel
- 800-meter freestyle, women: Katie Ledecky
- 800-meter freestyle, men: Robert Finke
- 1500-meter freestyle, men: Finke
- 1500-meter freestyle, women: Ledecky
Breaststroke Gold Medals
- 100-meter breaststroke, women: Lydia Jacoby
Butterfly Gold Medals
- 100-meter butterfly, men: Dressel
Medley and Relay Gold Medals
- 400-meter individual medley: Chase Kalisz
- 4 x 100-meter freestyle relay, men: Dressel, Blake Pieroni, Bowe Becker, Zach Apple
- 4 x 100-meter medley relay, men: Ryan Murphy, Michael Andrew, Dressel, Apple
Top Olympic Swimmers
- The most decorated Olympian of all time, Michael Phelps, has won 28 medals (23 gold) in his athletic career, according to Team USA.
- Jenny Thompson (12 medals), Dara Torres (12 medals) and Natalie Coughlin (12 medals) are the most decorated female Olympic swimmers, per Team USA.
- After winning 7 events at the 1972 Munich Games, swimmer Mark Spitz held the record for most gold medals won at a single Olympic games, according to the official Olympics website.
- Phelps beat this record with 8 gold medals at the 2008 Games in Beijing.
Total Medal Count for Team USA Swimming
After the 2106 Rio olympics, the U.S. swim team walked away with 121 medals (46 gold, 37 silver, 37 bronze), according to Team USA.
World Records
These are the current world swim records, according to the Federation Internationale de Natation (FINA).
Backstroke
- 50 meters:
- Men: Hunter Armstrong, 23 seconds, 71 milliseconds (2022)
- Women: Xiang Liu, 26 seconds, 98 milliseconds (2018)
- 100 meters:
- Men: Thomas Ceccon, 51 seconds, 60 milliseconds (2022)
- Women: Kaylee McKeown, 57 seconds, 45 milliseconds (2021)
- 200 meters:
- Men: Aaron Peirsol, 2 minutes, 7 seconds, 28 milliseconds (2009)
- Women: McKeown, 2 minutes, 3 seconds, 14 milliseconds (2023)
Breaststroke
- 50 meters:
- Men: Adam Peaty, 25 seconds, 95 milliseconds (2017)
- Women: Benedetta Pilato, 29 seconds, 30 milliseconds (2021)
- 100 meters:
- Men: Peaty, 56 seconds, 88 milliseconds (2019)
- Women: King, 1 minute, 4 seconds, 13 milliseconds (2017)
- 200 meters:
- Men: Zack Subblety-Cook, 2 minutes, 5 seconds, 95 milliseconds (2022)
- Women: Tatjana Schoenmaker, 2 minutes, 18 seconds, 95 milliseconds (2020)
Butterfly
- 50 meters:
- Men: Andrii Govorov, 22 seconds, 27 milliseconds (2018)
- Women: Sarah Sjoestroem, 24 seconds, 43 milliseconds (2014)
- 100 meters:
- Men: Caleb Dressel, 49 seconds, 45 milliseconds (2021)
- Women: Sjoestroem, 55 seconds, 48 milliseconds (2016)
- 200 meters:
- Men: Kristof Milak, 1 minute, 50 seconds, 34 milliseconds (2022)
- Women: Zige Liu, 2 minutes, 1 seconds, 81 milliseconds (2009)
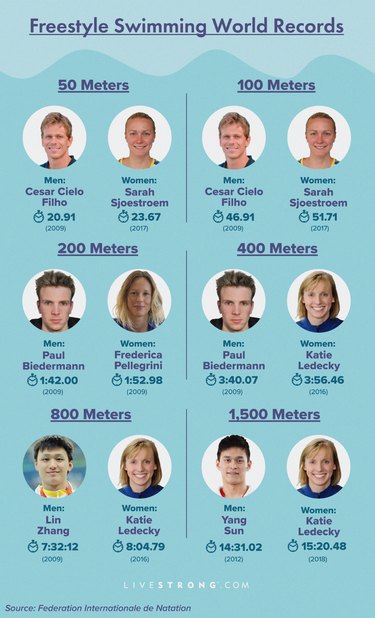
Freestyle
- 50 meters:
- Men: Cesar Cielo Filho, 20 seconds, 91 milliseconds (2009)
- Women: Sarah Sjoestroem, 23 seconds, 67 milliseconds (2017)
- 100 meters:
- Men: David Popovici, 46 seconds, 86 milliseconds (2022)
- Women: Sjoestroem, 51 seconds, 71 milliseconds (2017)
- 200 meters:
- Men: Paul Biedermann, 1 minute, 42 seconds (2009)
- Women: Frederica Pellegrini, 1 minute, 52 seconds, 98 milliseconds (2009)
- 400 meters:
- Men: Biedermann, 3 minutes, 40 seconds, 7 milliseconds (2009)
- Women: Summer Mcintosh, 3 minutes, 56 seconds, 8 milliseconds (2023)
- 800 meters:
- Men: Lin Zhang, 7 minutes, 32 seconds, 12 milliseconds (2009)
- Women: Ledecky, 8 minutes, 4 seconds, 79 milliseconds (2016)
- 1,500 meters:
- Men: Yang Sun, 14 minutes, 31 seconds, 2 milliseconds (2012)
- Women: Ledecky, 15 minutes, 20 seconds, 48 milliseconds (2018)
Medley
- 200-meter individual:
- Men: Ryan Lochte, 1 minute, 54 seconds (2011)
- Women: Katinka Hosszu, 2 minutes, 6 seconds, 12 milliseconds (2015)
- 400-meter individual:
- Men: Michael Phelps, 4 minutes, 3 seconds, 84 milliseconds (2008)
- Women: Mcintosh, 4 minutes, 25 seconds, 87 milliseconds (2023)
Ironman Records
The full Ironman triathlon race entails a 2.4-mile swim, 112-mile bike and 26.2-mile run, according to Bicycling, a leading publication in cycling.
These are the men's and women's top five finish times of all time for the Ironman race, according to the triathlon data website Trirating.
Top 5 Men
- Kristian Blummenfelt, 7 hours, 21 minutes, 11 seconds (2021)
- Jan Frodeno, 7 hours, 27 minutes, 53 seconds (2018)
- Magnus Elbaek Ditlev, 7 hours, 35 minutes, 48 seconds (2022)
- Alistair Brownlee, 7 hours 38 minutes, 47 second (2022)
- Tim Don, 7 hours, 40 minutes, 23 seconds (2017)
Top 5 Women
- Chrissie Wellington, 8 hours, 18 minutes, 13 seconds (2011)
- Laura Philipp, 8 hours, 18 minutes, 20 seconds (2022)
- Wellington, 8 hours, 19 minutes, 13 seconds (2010)
- Daniela Ryf, 8 hours, 22 minutes, 4 seconds (2016)
- Anne Huag, 8 hours, 22 minutes, 42 seconds (2022)
The Longest Ocean Swims
- The longest recorded ocean swim by a woman is about 77.3 miles, completed by Chloe McCardel in October 2014, according to Guinness World Records.
- The longest recorded ocean swim by a man is about 139.8 miles, completed by Pablo Fernandez in July 2021, according to Guinness World Records.
Historical Facts About Swimming
Although swimming may feel like it has grown more popular in recent years, with many swimmers likely inspired by the success of the U.S. Olympic team, the sport has been in the Olympics for more than 100 years.
- Swimming became an organized sport in the 19th century, according to the official Olympic website.
- Swimming has been a part of the Olympic Games since 1896.
- The first events were the freestyle and breaststroke.
- The backstroke was added in 1904.
- In 1844, the front crawl (freestyle) stroke was first mentioned in a competitive context, according to Swim England.
- The butterfly stroke was introduced in the 1930s, according to Swim England.
- In the 2008 Beijing Olympics, 41-year-old Dara Torres won a silver medal, becoming the oldest Olympic swimming medalist, according to Guinness World Records.
Swimming Pool Statistics
When summer rolls around, everyone's clamoring to get to the nearest swimming pool. Learn how many people actually have a pool, how big the average home pool is and how sanitary public pools are.
- Only about 12% of pool inspections in 2008 found public health violations that led to the immediate closure of the facility, according to the CDC.
- More than 10% of regular pool inspections in the U.S. found violations in levels of disinfectant, which help prevent the spread of germs in pool water.
- About 56% of spas violate local health ordinance and 11% of these violations result in immediate closure.
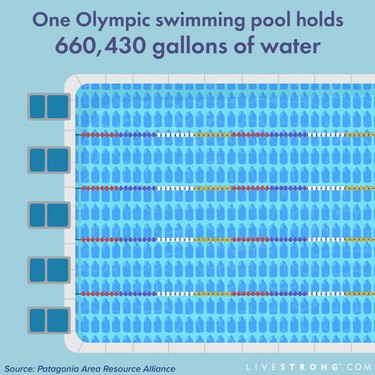
- An Olympic pool is 50 meters long and 25 meters wide, according to Patagonia Area Resource Alliance, a nonprofit dedicated to preserving local mountains and wildlife in Patagonia, Arizona, with marks to guide swimmers to stay in their lanes.
- Olympic pools are at least 2 meters deep (6.5 feet).
- Olympic pools hold 660,430 gallons of water.
- There are several common home swimming pool sizes, according to Pool Pricer, a swimming pool industry publication:
- 20 feet long by 10 feet wide
- 30 feet long by 15 feet wide
- 40 feet long by 20 feet wide
- 15.7% of occupied homes in the U.S. have a swimming pool, according to a 2011 Housing Profile conducted by the U.S. Department of Housing and Urban Development.
- The temperature of a swimming pool should be between 77 and 82 degrees Fahrenheit (25 to 28 degrees Celsius), according to FINA.
- Journal of the Australian Swimming Coaches & Teachers Association & Swim Australia: "Swimming in Australia"
- Swim England: "Swim Census 2018: Workforce and Learn to Swim Statistics"
- CDC: "Publications, Data, & Statistics"
- USA Swimming: "About USA Swimming"
- American Red Cross: "Water Safety Poll"
- NBC Sports: "USA Swimming Lists Top 50 Swim Cities in U.S."
- Swim Catalina: "Individual Records"
- SHARP Center for Women & Girls: "Women in the Olympic and Paralympic Games"
- USA Swimming: "Learn to Swim"
- USA Swimming: "Cultural Inclusion Resource Guide"
- Journal of Exercise Rehabilitation: "Effect of regular Swimming Exercise on the Physical Composition, Strength, and Blood Lipid of Middle-Aged Women"
- Journal of Rheumatology: "Improved Function and Reduced Pain after Swimming and Cycling Training in Patients with Osteoarthritis"
- British Journal of Sports Medicine: "Associations of Specific Types of Sports and Exercise With All-Cause and Cardiovascular-Disease Mortality: a Cohort Study of 80306 British Adults"
- ACE: "Make a Splash With Water Fitness"
- Sports Health: "Epidemiology of Injuries and Prevention Strategies in Competitive Swimmers"
- The Pain Clinic: "Musculoskeletal Pain in Elite Competitive Male Swimmers"
- Harvard Health Publishing: "Calories Burned in 30 Minutes for People of Three Different Weights"
- Stop Drowning Now: "Stop Drowning Now"
- World Health Organization: "Drowning"
- South African Medical Journal: "Keeping our Heads Above Water: A Systematic Review of Fatal Drowning in South Africa"
- U.S. Masters Swimming: "Fitness Pace Chart"
- ESPN: "For Comparison's Sake: Aroldis Chapman's Fastball"
- Guinness World Records: "Fastest Swim Crossing of the North Channel"
- Guinness World Records: "Fastest Leme–Pontal Swim"
- Guinness World Records: "Fastest Time to Swim the Persian Gulf"
- NCAA: "Swimming"
- Team USA: "A Look Back at Each of Team USA'S 46 Gold Medals Won at The Rio Olympics"
- Team USA: "Michael Phelps"
- Team USA: "The 29 Most Decorated Female U.S. Olympians of All Time"
- Olympics: "Mark Spitz"
- Team USA: "Team USA's 2016 by the Numbers"
- FINA: "Swimming"
- Bicycling: "Everything You Need to Know About Triathlon Distances"
- TriRating: "Ironman-Distance Rankings"
- Olympic: "History"
- Swim England: "The History of Front Crawl Swimming"
- Swim England: "History of Butterfly Swimming"
- Guinness World Records: "Oldest Olympic Swimming Medallist"
- Patagonia Area Resource Alliance: "How Much Water Does an Olympic Sized Swimming Pool Hold?"
- Pool Pricer: "Inground Pool Sizes: Three Questions to Ask Yourself"
- U.S. Department of Housing and Urban Development: "2011 Housing Profile: United States"
- NCAA: "Swimming & Diving Records"
- FINA: "SWIMMING POOL CERTIFICATE GUIDE"
- Australian Sports Commission: "Swimming State of Play"
- USA Swimming: "2020 Membership Demographics Report"
- Sport England: "Active Lives Adult Survey November 2021-2022
- Department of Statistics Singapore: Singapore in Figures 2019