
Running, cycling, Pilates, at-home workouts — the list of exercise options is pretty much endless. Thanks to constant improvements in streaming services and other fitness technology, exercise is accessible to more people than ever, in studios and living rooms.
Yet the number of adults who don't get the recommended physical activity for overall health is at a record low.
Video of the Day
Video of the Day
How many people meet exercise goals in the U.S. and around the world? What are the actual benefits of exercising frequently? And what are the most popular fitness classes out there?
Read on to learn these exercise statistics and more.
Global Exercise Statistics
No matter where they live, adults between the ages of 18 and 64 should aim to complete 150 to 300 minutes of moderate cardio activity each week, according to the World Health Organization's (WHO) Guidelines on Physical Activity and Sedentary Behavior. They should also aim for two or more strength-training sessions per week. (Note: The terms we use below for sex and gender reflect the language used in each cited source.)
- 1 in 4 adults don't meet the global recommended physical activity levels, according to the WHO.
- More than 80% of the world's teens don't get enough physical activity.
- In high-income countries, 26% of men and 35% of women don't get enough physical activity.
- In low-income countries, 12% of men and 24% of women don't get enough physical activity.
U.S. Exercise Statistics
The U.S. Department of Health and Human Services' Physical Activity Guidelines for Americans recommend that adults get at least 150 to 300 minutes of moderate-intensity cardio exercise each week, along with two strength training workouts. However, fewer than half of adults meet both of these recommendations, according to the Centers for Disease Control and Prevention (CDC).
- 46.9% of adults in the U.S. meet the Physical Activity Guidelines for aerobic physical activity, according to the CDC.
- 24.2% of adults meet the guidelines for both aerobic and muscle-strengthening activity.
- 19% of Americans said they felt too intimidated to go to a gym or fitness studio in 2022, according to MINDBODY's 2022 Fitness Trends Report.
- More than 15% of adults in all U.S. states are physically inactive or don't exercise regularly, according to a January 2020 report by the CDC. Here's a look at the percentage of people who are physically active by state:
- Alabama: 69%
- Alaska: 79.7%
- Arizona: 76.3%
- Arkansas: 67.5%
- California: 79.6%
- Colorado: 82.7%
- Connecticut: 77.3%
- Delaware: 71.6%
- Florida: 72%
- Georgia: 71.5%
- Hawaii: 78.4%
- Idaho: 78.5%
- Illinois: 75.7%
- Indiana: 71.7%
- Iowa: 75.8%
- Kansas: 75%
- Kentucky: 67.8%
- Louisiana: 69.1%
- Maine: 76.8%
- Maryland: 76.1%
- Massachusetts: 76.7%
- Michigan: 74.9%
- Minnesota: 78.8%
- Mississippi: 67%
- Missouri: 73.2%
- Montana: 77.5%
- Nebraska: 75.8%
- Nevada: 74.4%
- New Hampshire: 78.2%
- New Jersey: 71.3%
- New Mexico: 77.7%
- New York: 73.4%
- North Carolina: 75.3%
- North Dakota: 75.4%
- Ohio: 73%
- Oklahoma: 69.8%
- Oregon: 80.8%
- Pennsylvania: 75.2%
- Rhode Island: 74.1%
- South Carolina: 72.8%
- South Dakota: 77.7%
- Tennessee: 70%
- Texas: 72.1%
- Utah: 81.4%
- Vermont: 79.5%
- Virginia: 76%
- Washington: 81.7%
- West Virginia: 70.2%
- Wisconsin: 78.6%
- Wyoming: 75.9%
The Most and Least Active States
The most physically active state is Colorado, while the least physically active state is Mississippi.
- Walking is the most popular exercise in the U.S., with 30% of Americans participating, according to a 2016 report from the U.S. Bureau of Labor Statistics.
- 8.9% participate in weight lifting, the second most popular form of exercise in the U.S.
- 8.8% participate in running.
- 8.7% use gym cardio equipment.
U.S. Exercise Statistics by City
- According to a 2019 report conducted by ClassPass, a virtual fitness class platform:
- Residents of Denver were most likely to take fitness classes at 7:30 a.m. or earlier.
- Users in Chicago were most likely to book a class between 11 a.m. and 1 p.m.
- People in Miami were most likely to book a class at 8 p.m. or later.
- Residents of Kansas City were most likely to reserve a class in a different city.
- Users in Los Angeles were most likely to make last-minute reservations.
- People in Salt Lake City were most likely to book a class with a workout buddy.
- Folks in Minneapolis were least likely to skip or cancel a class.
- Houston residents were most likely to book a Megaformer Pilates class.
- New Yorkers made the most total exercise class reservations.
- Residents of Denver were most likely to take fitness classes at 7:30 a.m. or earlier.
- The most active cities in the U.S., according to how many citizens exercise at least once a week, per MINDBODY's 2022 Wellness Index, are:
- Miami: 83%
- San Francisco: 80%
- Atlanta: 54%
Exercise Statistics by Age Group
Regular physical activity is important for people of all ages — and exercise is easily scalable for different fitness and ability levels — but it's often most common among younger adults.
European Exercise Statistics by Age Group and Gender
Here's a look at the percentage of people in European countries who exercise or play a sport regularly or with some regularity in various age groups, according to the European Union. (Note: Data is not available for every age group in every country.)
- Austria
- Men 15 to 24: 73%
- Women 15 to 24: 57%
- Men 25 to 39: 56%
- Women 25 to 39: 39%
- Men 40 to 54: 33%
- Women 40 to 54: 28%
- Men 55-plus: 33%
- Women 55-plus: 25%
- Belgium
- Men 15 to 24: 89%
- Women 15 to 24: 72%
- Men 25 to 39: 54%
- Women 25 to 39: 46%
- Men 40 to 54: 57%
- Women 40 to 54: 40%
- Men 55-plus: 40%
- Women 55-plus: 33%
- Bulgaria
- Men 15 to 24: 66%
- Women 15 to 24: 41%
- Men 25 to 39: 34%
- Women 25 to 39: 21%
- Men 40 to 54: 12%
- Women 40 to 54: 16%
- Men 55-plus: 5%
- Women 55-plus: 3%
- Croatia
- Men 15 to 24: 56%
- Women 15 to 24: 38%
- Men 25 to 39: 32%
- Women 25 to 39: 33%
- Men 40 to 54: 12%
- Women 40 to 54: 26%
- Men 55-plus: 18%
- Women 55-plus: 10%
- Cyprus
- Men 15 to 24: 70%
- Women 15 to 24: 54%
- Men 25 to 39: 63%
- Women 25 to 39: 33%
- Men 40 to 54: 35%
- Women 40 to 54: 26%
- Men 55-plus: 28%
- Women 55-plus: 20%
- Czech Republic
- Men 15 to 24: 62%
- Women 15 to 24: 44%
- Men 25 to 39: 43%
- Women 25 to 39: 44%
- Men 40 to 54: 33%
- Women 40 to 54: 31%
- Men 55-plus: 17%
- Women 55-plus: 19%
- Denmark
- Men 15 to 24: 77%
- Women 15 to 24: 75%
- Men 25 to 39: 58%
- Women 25 to 39: 62%
- Men 40 to 54: 62%
- Women 40 to 54: 64%
- Men 55-plus: 56%
- Women 55-plus: 62%
- Estonia
- Men 15 to 24: 66%
- Women 15 to 24: 60%
- Men 25 to 39: 47%
- Women 25 to 39: 39%
- Men 40 to 54: 44%
- Women 40 to 54: 35%
- Men 55-plus: 19%
- Women 55-plus: 20%
- Finland
- Men 15 to 24: 72%
- Women 15 to 24: 89%
- Men 25 to 39: 78%
- Women 25 to 39: 72%
- Men 40 to 54: 68%
- Women 40 to 54: 62%
- Men 55-plus: 66%
- Women 55-plus: 63%
- France
- Men 15 to 24: 55%
- Women 15 to 24: 50%
- Men 25 to 39: 53%
- Women 25 to 39: 36%
- Men 40 to 54: 46%
- Women 40 to 54: 42%
- Men 55-plus: 35%
- Women 55-plus: 37%
- Germany
- Men 15 to 24: 69%
- Women 15 to 24: 53%
- Men 25 to 39: 60%
- Women 25 to 39: 45%
- Men 40 to 54: 51%
- Women 40 to 54: 46%
- Men 55-plus: 42%
- Women 55-plus: 43%
- Greece
- Men 15 to 24: 64%
- Women 15 to 24: 41%
- Men 25 to 39: 42%
- Women 25 to 39: 35%
- Men 40 to 54: 26%
- Women 40 to 54: 20%
- Men 55-plus: 6%
- Women 55-plus: 4%
- Hungary
- Men 15 to 24: 69%
- Women 15 to 24: 54%
- Men 25 to 39: 38%
- Women 25 to 39: 37%
- Men 40 to 54: 30%
- Women 40 to 54: 25%
- Men 55-plus: 20%
- Women 55-plus: 25%
- Ireland
- Men 15 to 24: 74%
- Women 15 to 24: 62%
- Men 25 to 39: 59%
- Women 25 to 39: 50%
- Men 40 to 54: 60%
- Women 40 to 54: 55%
- Men 55-plus: 43%
- Women 55-plus: 37%
- Italy
- Men 15 to 24: 78%
- Women 15 to 24: 55%
- Men 25 to 39: 52%
- Women 25 to 39: 43%
- Men 40 to 54: 38%
- Women 40 to 54: 22%
- Men 55-plus: 12%
- Women 55-plus: 5%
- Latvia
- Men 15 to 24: 76%
- Women 15 to 24: 58%
- Men 25 to 39: 45%
- Women 25 to 39: 28%
- Men 40 to 54: 25%
- Women 40 to 54: 23%
- Men 55-plus: 14%
- Women 55-plus: 14%
- Lithuania
- Men 15 to 24: 78%
- Women 15 to 24: 53%
- Men 25 to 39: 25%
- Women 25 to 39: 32%
- Men 40 to 54: 17%
- Women 40 to 54: 33%
- Men 55-plus: 29%
- Women 55-plus: 29%
- Luxembourg
- Men 15 to 24: 78%
- Women 15 to 24: 73%
- Men 25 to 39: 60%
- Women 25 to 39: 46%
- Men 40 to 54: 47%
- Women 40 to 54: 61%
- Men 55-plus: 54%
- Women 55-plus: 49%
- Malta
- Men 15 to 24: 66%
- Women 15 to 24: 39%
- Men 25 to 39: 40%
- Women 25 to 39: 43%
- Men 40 to 54: 21%
- Women 40 to 54: 25%
- Men 55-plus: 22%
- Women 55-plus: 15%
- Netherlands
- Men 15 to 24: 90%
- Women 15 to 24: 72%
- Men 25 to 39: 55%
- Women 25 to 39: 43%
- Men 40 to 54: 50%
- Women 40 to 54: 56%
- Men 55-plus: 54%
- Women 55-plus: 54%
- Poland
- Men 15 to 24: 80%
- Women 15 to 24: 49%
- Men 25 to 39: 37%
- Women 25 to 39: 33%
- Men 40 to 54: 27%
- Women 40 to 54: 23%
- Men 55-plus: 12%
- Women 55-plus: 16%
- Portugal
- Men 15 to 24: 62%
- Women 15 to 24: 56%
- Men 25 to 39: 46%
- Women 25 to 39: 26%
- Men 40 to 54: 30%
- Women 40 to 54: 16%
- Men 55-plus: 11%
- Women 55-plus: 14%
- Romania
- Men 15 to 24: 65%
- Women 15 to 24: 40%
- Men 25 to 39: 25%
- Women 25 to 39: 23%
- Men 40 to 54: 12%
- Women 40 to 54: 8%
- Men 55-plus: 11%
- Women 55-plus: 10%
- Slovakia
- Men 15 to 24: 57%
- Women 15 to 24: 52%
- Men 25 to 39: 33%
- Women 25 to 39: 35%
- Men 40 to 54: 24%
- Women 40 to 54: 26%
- Men 55-plus: 14%
- Women 55-plus: 16%
- Slovenia
- Men 15 to 24: 73%
- Women 15 to 24: 66%
- Men 25 to 39: 58%
- Women 25 to 39: 53%
- Men 40 to 54: 50%
- Women 40 to 54: 46%
- Men 55-plus: 45%
- Women 55-plus: 46%
- Spain
- Men 15 to 24: 80%
- Women 15 to 24: 59%
- Men 25 to 39: 59%
- Women 25 to 39: 39%
- Men 40 to 54: 44%
- Women 40 to 54: 39%
- Men 55-plus: 34%
- Women 55-plus: 30%
- Sweden
- Men 15 to 24: 78%
- Women 15 to 24: 60%
- Men 25 to 39: 75%
- Women 25 to 39: 66%
- Men 40 to 54: 60%
- Women 40 to 54: 74%
- Men 55-plus: 62%
- Women 55-plus: 67%
- Switzerland
- 6 to 10: 89.5%
- 11 to 16: 39.1%
- 15 to 34: 80.2%
- 35 to 49: 74.6%
- 50 to 64: 74.5%
- 65 and older: 72%
- United Kingdom
- Men 15 to 24: 75%
- Women 15 to 24: 51%
- Men 25 to 39: 54%
- Women 25 to 39: 49%
- Men 40 to 54: 49%
- Women 40 to 54: 37%
- Men 55-plus: 40%
- Women 55-plus: 37%
- Men 15 to 24: 75%
Here's a look at the percentage of people in other European countries who exercise "sufficiently" (often, 150 to 210 minutes a week) across age groups, according to national surveys (linked for each country.)
- Iceland
- Girls 15 years: 16%
- Boys 15 years: 23%
- Women 18 to 64: 74.5%
- Men 18 to 84: 71.8%
- Women 65-plus: 70.6%
- Men 65-plus: 66.1%
- Scotland
- Men 16 to 24: 74%
- Women 16 to 24: 75%
- Men 25 to 34: 79%
- Women 25 to 34: 73%
- Men 35 to 44: 77%
- Women 35 to 44: 74%
- Men 45 to 54: 79%
- Women 45 to 54: 73%
- Men 55 to 64: 72%
- Women 55 to 64: 61%
- Men 65 to 74: 66%
- Women 65 to 74: 57%
- Men 75-plus: 51%
- Women 75-plus: 39%
- Wales
- Men 16 to 44: 65%
- Women 16 to 44: 54%
- Men 45 to 64: 58%
- Women 45 to 64: 51%
- Men 65-plus: 48%
- Women 65-plus: 39%
U.S. Exercise Statistics by Age Group
- The percentage of U.S. adults who are physically inactive increases with age, according to America's Health Rankings 2021, a report created by the United Health Foundation:
- 18 to 44: 19.2%
- 45 to 64: 24.8%
- 65 and older: 30.6%
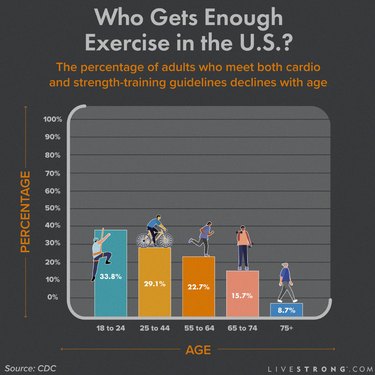
- The percentage of adults who meet both cardio and strength-training guidelines declines with age, according to 2018 data from the CDC:
- 18 to 24: 33.8%
- 25 to 44: 29.1 %
- 45 to 54: 22.7%
- 55 to 64: 18.6%
- 65 to 74: 15.7%
- 75 and older: 8.7%
U.S. Exercise Statistics by Race and Ethnicity
In the majority of states across the U.S., adults who identify as Hispanic or non-Hispanic Black report the highest levels of inactivity and people who identify as white report exercising the most, according to the CDC.
Here's a look at the percentage of people who are physically inactive, according to their self-identified race or ethnicity, per the United Health Foundation. The terms we use below for race and ethnicity reflect the language used by the UHF.
- American Indian or Alaskan Native: 29.9%
- Asian: 20.4%
- Black: 28.2%
- Hawaiian or Pacific Islander: 22.1%
- Hispanic: 30.6%
- Multiracial: 21.2%
- White: 20.9%
Groups That Promote Diversity in Exercise
Fitness Class Statistics
The pandemic continues to take a toll on the mental health of Americans, especially among people in the younger generation. More than half of surveyed 18 to 24-year-olds said the pandemic negatively impacted their mental wellbeing, according to MINDBODY's 2022 Wellness Index. But participating in fitness has been a positive outlet for relieving stress and anxiety. About 77% of Americans say being physically active helps improve their mental health.
Learn which classes topped the charts and which were the least popular.
- 35% of Americans started attending an in-person fitness class they found through virtual fitness, according to MINDBODY.
- 43% of millennials (ages 25 to 40) are more likely to go to in-person classes they first discovered virtually, followed by 30% of generation Z (ages 18 to 24) and 34% of generation X (ages 41-56), per MINDBODY.
- The most popular fitness class among ClassPass users in 2021 was strength training, according to ClassPass's 2021 Fitness & Beauty Trends Report.
- Fitness class reservations have grown 329% since January 2021.
- ClassPass users are booking classes 10% higher now than during pre-pandemic times.
- 60% of ClassPass users prefer high-energy workouts, such as boxing and HIIT, while 40% like relaxing and restorative exercises like yoga.
- 15% of people who work from home use their lunch hour to do a workout, while only 4% of people who work at the office will do a lunchtime workout
- Tuesday was the most popular day of the week to work out.
- 57% of people working at the office are likely to work out at a fitness studio on the way home.
- 70% of professionals are attending fitness studios on the days they work from home.
- Sunday is the most popular rest day of the week.
- 5:30 p.m. was the most popular time to work out on commuting days, according to ClassPass.
- 45% of ClassPass users say they are more likely to follow a new workout routine if they take a friend to a fitness class during their first month on the app.
- Dance is one of the top 10 most booked classes on ClassPass, with Wednesdays at 7 p.m. being the most popular time slot.
Cardio Exercise Statistics
Cardio looks different from person to person. While some love a jog around the neighborhood, others prefer quality time with their rowing machine. And with options like high-intensity interval training, indoor cycling and aerobics classes, there's a cardio exercise for just about everyone.
- About 17.6 million people in the U.S. registered for road races in 2019, according to Running USA's 2020 U.S. Running Trends Report. Check out more interesting running statistics.
- Swimming is the fourth most popular recreational sport in the country, according to the CDC. Discover more interesting swimming statistics.
- About 36% of children 7 to 17 years go for at least six swims per year.
- Roughly 15% of adults swim at least six times annually.
- About 870,000 people in the U.S. commute to work by bike — that's 0.6% of workers in the country, according to the U.S. Census Bureau. Learn more unique cycling statistics.
- Around the world, cyclists logged 10 billion miles with 480.2 billion feet of elevation gain on Strava in 2020, according to Strava's 2021 Year in Sport Data Report.
- Around the world, cyclists logged 10 billion miles with 480.2 billion feet of elevation gain on Strava in 2020, according to Strava's 2021 Year in Sport Data Report.
Strength-Training Statistics
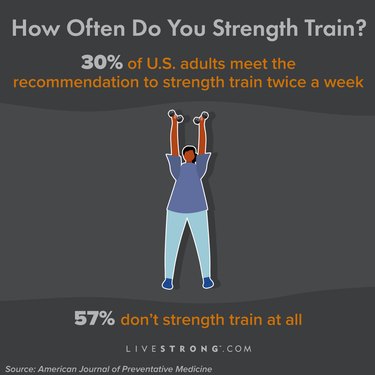
Only about 30.2% of U.S. adults meet exercise recommendations of doing two or more strength-training workouts a week, according to a December 2018 study in the American Journal of Preventative Medicine — and 57.8% reported not doing strength training at all.
While cardio is crucial for heart health, the health benefits of strength training go way beyond building muscle.
- In its annual predictions for the top fitness trends of the upcoming year, the American College of Sports Medicine ranked body-weight strength training 3rd and strength training with free weights 8th.
- 8 to 12 repetitions of strength-training exercises are recommended for beginners, according to the American Cancer Society.
- Two to three weekly strength sessions of 20 to 30 minutes each can improve muscle mass, bone strength and joint health.
- Inactive adults lose about 3% to 8% of their muscle per decade, according to a July 2012 study in Current Sports Medicine Reports.
- 10 weeks of strength training can lead to:
- A 3-pound (1.4-kilogram) increase in muscle mass.
- A 7% increase in metabolic rate (the rate at which your body burns calories).
- A 3.9-pound (1.8-kilogram) reduction in body fat.
- Strength-training classes were the most popular workout among ClassPass users in 2021, according to ClassPass's 2021 Fitness & Beauty Trends Report.
- The record for most push-ups in an hour is 3,249 reps, according to Guinness World Records.
- The heaviest weight lifted in a two-minute bench press is 8,994.86 pounds, according to Guinness World Records.
- The most pull-ups done in one minute is 74, per Guinness World Records.
- Justin Medeiros and Tia-Clair Toomey are the fittest athletes of all time, according to the 2022 CrossFit Games. Check out more interesting CrossFit statistics.
- After 12 weeks of CrossFit training, athletes saw a 22% improvement in muscular endurance, according to a January 2014 Journal of Sport and Human Performance study.
Exercise Benefits Statistics
Meeting the exercise guidelines each week may seem like a challenge, but there's a reason those standards are promoted by both the CDC and WHO: There are so many benefits of regular exercise for both your mental and physical health.
Exercise and Mental Health Statistics
- Walking for about an hour or running for 15 minutes each day is linked to a reduced risk of depression, according to a January 2019 study in JAMA Psychiatry.
- Just 5 minutes of physical activity can boost your mood, according to the American Psychological Association (APA).
- People who exercise regularly experience 43.2% fewer days of poor mental health, according to an August 2018 study in The Lancet Psychiatry.
- On average, people who don't work out experience a little more than 3 days of poor mental health per month, including symptoms of stress, depression and/or emotional concerns.
- Three to five 45-minute workouts per week were associated with fewer mental health concerns.
- Team sport participation was associated with a 22.3% reduction in poor mental health days.
- Cycling was associated with a 21.6% reduction in poor mental health days.
- Gym activities were associated with a 20.1% reduction in poor mental health days.
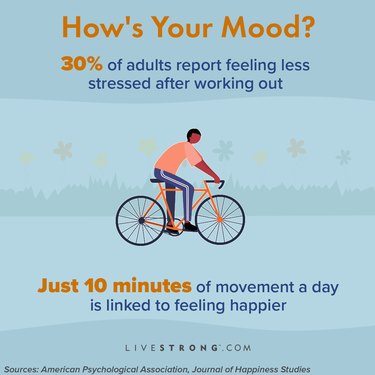
- As little as 10 minutes of exercise a day (or 1 full workout day per week) is linked to higher levels of happiness, according to an April 2019 review in the Journal of Happiness Studies.
Exercise and Stress Statistics
- 30% of adults report feeling less stressed after exercising, according to the APA's Stress in America Survey.
- 43% of adults use exercise to manage stress.
- 39% have skipped exercise when feeling overly stressed.
- 62% of adults who use exercise to manage stress say the strategy is effective.
- The percentage of exercisers who say they feel less stress after a workout varies by generation:
- Teens: 32%
- Millennials: 36%
- Gen Xers: 31%
- Boomers: 28%
- Matures: 16%
Exercise and Heart Disease Statistics
- 1 in every 5 deaths in the U.S. is caused by heart disease, and physical inactivity and a sedentary lifestyle are among the top contributing factors, according to the CDC.
- Higher levels of physical activity are associated with a 21% reduction in heart attacks in men and a 29% reduction for women, according to a December 2013 study in Current Cardiovascular Risk Reports.
- People who exercise more frequently have a 19% lower risk of high blood pressure than those who don't train as frequently, according to the American Heart Association.
Exercise and Life Expectancy Statistics
- Regular physical activity is associated with a 0.4 to 6.9-year increase in life expectancy, according to a July 2012 review in the Journal of Aging Research.
- At the population level, meeting the minimum physical activity guidelines may prevent about 46% of deaths associated with inactivity, according to a June 2019 study in The BMJ.
Exercise and Obesity Statistics
- 52.2% of adults living with obesity were told by a health professional to increase their activity level, according to the CDC.
- Less than 22% of adults who do not have obesity were told to be more active.
- The rate of obesity for adults with activity limitations was 23.1% higher than for adults without limitations, according to the Office of Disease Prevention and Health Promotion.
- 36.6% of adults with no activity limitations have obesity.
- 45% of adults with activity limitations have obesity.
Exercise and Work Productivity Statistics
- In a June 2016 study in the Journal of Sport and Health Sciences, physical activity helped improve cardio-respiratory fitness and productivity among office and computer workers, as well as healthcare workers and construction workers.
- Exercising during the work day has been linked with better concentration, work relationships and increased tolerance for stress, according to a September 2008 study in the International Journal of Workplace Health Management.
Exercise Injury Statistics
Exercise is generally a healthy and safe activity, but injuries do happen. Knowing how those accidents happen can help you stay safe in your workouts.
- Among active adults, 21.5% reported an injury in the last 12 months, according to a December 2018 study in Injury Epidemiology.
- The number of people injured by exercise and fitness equipment in 2021 varies by age, according to the National Safety Council:
- 0 to 4: 7,246 people
- 5 to 14: 30,552 people
- 15 to 24: 76,078 people
- 25 to 64: 222,405 people
- 65 and older: 72,943 people
- In 2021, more than 3 million injuries that resulted in trips to the emergency department in the U.S. were caused by sports and recreational activities, according to the National Safety Council.
- 409, 224 of these injuries were caused by exercise or exercise equipment.
- 375,797 of these injuries were caused by bicycles or bicycle equipment.
- 259,779 of these injuries were caused by basketball.
- More than 3.5 million kids 14 and younger get injured each year playing sports, according to Johns Hopkins Medicine.
- 21% of all brain injuries to kids are caused by sports or recreational activities.
- WHO: "WHO Guidelines on Physical Activity and Sedentary Behaviour"
- WHO: "Physical Activity"
- Social Science & Medicine: "Why Have Physical Activity Levels Declined Among Chinese Adults? Findings From the 1991-2006 China Health and Nutrition Surveys"
- U.S. Department of Health and Human Services: "Physical Activity Guidelines for Americans"
- CDC: "Exercise or Physical Activity"
- CDC: "QuickStats: Percentage* of Adults Aged ≥20 Years Who Reported Being Told by a Doctor or Health Professional to Increase Their Physical Activity,† by Age Group and Obesity Status§ — National Health and Nutrition Examination Survey, United States, 2011–2014"
- U.S. Bureau of Labor Statistics: "Sports and Exercise Among Americans"
- MINDBODY: "Fitness Trends in America"
- United Health Foundation: "America's Health Rankings"
- CDC: "Participation in Leisure-Time Aerobic and Muscle-Strengthening Activities that Meet the Federal 2008 Physical Activity Guidelines for Americans Among Adults Aged 18 and Over, by Selected Characteristics: United States, Selected Years 1998–2017"
- CDC: "Adult Physical Inactivity Prevalence Maps by Race/Ethnicity"
- Sports & Fitness Industry Association: "Running/Jogging Participation Report 2020"
- CDC: "Publications, Data, & Statistics"
- U.S. Census Bureau: "May 17 is National Bike to Work Day"
- American Journal of Preventative Medicine: "Muscle-Strengthening Exercise Among 397,423 U.S. Adults: Prevalence, Correlates, and Associations With Health Conditions"
- American Cancer Society: "5 Benefits of Strength Training"
- Current Sports Medicine Reports: "Resistance Training is Medicine: Effects of Strength Training on Health"
- Guinness World Records: "5 Strength Records from 2018 to Leave you Breathless"
- Guinness World Records: "7 New Strength Records Which Raised the Bar During 2017"
- CrossFit Games: "2021 Leaderboard"
- Journal of Sport and Human Performance: "Effect of CrossFit on Health Related Physical Fitness: A Pilot Study"
- JAMA Psychiatry: "Assessment of Bidirectional Relationships Between Physical Activity and Depression Among Adult"
- American Psychological Association: "The Exercise Effect"
- Journal of Happiness Studies: "A Systematic Review of the Relationship Between Physical Activity and Happiness"
- The Lancet Psychiatry: "Association Between Physical Exercise and Mental Health in 1·2 Million Individuals in the USA Between 2011 and 2015: a Cross-Sectional Study"
- APA: "Exercise: A Healthy Stress Reliever"
- Current Cardiovascular Risk Reports: "Physical Activity and Exercise for Secondary Prevention among Patients with Cardiovascular Disease"
- American Heart Association: "Exercise Could Lower High Blood Pressure Risk"
- Journal of Aging Research: "Does Physical Activity Increase Life Expectancy? A Review of the Literature"
- The BMJ: "Physical Activity Trajectories and Mortality: Population Based Cohort Study"
- Annals of the New York Academy of Sciences: "Physical Activity in Obesity and Metabolic Syndrome"
- Journal of Occupational and Environmental Medicine: "The association between work performance and physical activity, cardiorespiratory fitness, and obesity
- International Journal of Workplace Health Management: "Exercising at Work and Self-Reported Work Performance"
- National Safety Council: "Facts + Statistics: Sports injuries"
- Johns Hopkins Medicine: "Sports Injury Statistics"
- MINDBODY: "2022 Fitness Trends Report"
- MINDBODY: "The 10 Most Active Cities in America in 2022"
- Running USA: "2020 U.S. Running Trends Report"
- Strava: "Year in Sport 2021"
- Office of Disease Prevention and Health Promotion: "Nutrition, Physical Activity, and Obesity"
- Journal of Sport and Health Science: "Exercise Is More Than Medicine: The Working Age Population's Well-Being and Productivity"